Wednesday, September 22, 2010

Jupiter at its closest opposition in nearly 50 years

Today at around 13:00 UTC, the Jupiter system will be in opposition, when the planet and its attendant moons are on the opposite side of the Earth's sky from the Sun.  This means that the planet will be visible as a brilliant star in the sky all night long, rise in the east at sunset and setting in the west at sunrise.  It also means that Earth is at its closest approach to Jupiter this year, with Jupiter only 591,560,000 kilometers (367,578,000 miles) away.  From the perspective of any amateur astronomers out there, this makes it a great time to take a look at Jupiter as it is nearly 50 seconds of arc in diameter in the night sky (though let's kill any "Jupiter hoax" in the bud, Jupiter's apparent diameter is still 1/36 of the apparent diameter of the Moon).  That is large enough to pick out Jupiter's cloud bands on even the most modest of telescopes.  Despite its great distant, its large size also makes it bright enough to easily pick out in the sky.

In addition to being the closest Earth will be to Jupiter all year, this is also the closest Earth has been to the giant planet since 1963.  That is because Jupiter is close to perihelion, its closest point in its orbit to the Sun.  As you can see in the graphic above, Jupiter's orbit is slightly eccentric, and right now it is closer to the Sun (and the Earth) than it would be on the opposite side of its orbit (near apohelion), which is slightly off the graphic that is centered on the Sun.  This makes this opposition a particularly good one to check out.  Don't forget though that even if you are unable to check out Jupiter tonight, it will still be an excellent target to view for the next couple of months, though it will become more and more a planet to view in the evening.

Many planetary astronomers have been taking advantage of the current opposition to take some great images of the giant planet and its moons, like the one at left.  I love the detail you can see in this image, taken on September 20 by astronomer Damian Peach.  The southern equatorial belt is still faded and there is no indication that it will reappear anytime soon.  A great place to check for more fresh images of Jupiter is the ALPO-Japan site, where astronomers from around the world post their latest and greatest shots. Another great site to check out is Cloudy Nights forum, which includes some great discussion of how these images are taken.

So please, definitely take this chance to look up at Jupiter!

Tuesday, September 21, 2010

Io Volcano of the Week: Isum

I apologize for my absence the last couple of weeks.  When you write a blog in your spare time, it exists at the pleasure of my other obligations, my health, and other demands on my spare time.  So when a busy period with work, a nasty cold, and Halo: Reach all hit in the same week, well, unfortunately this blog takes a bit of a back seat.  This week I am feeling much better, work is a bit quieter (wait, there is a Titan flyby on Friday, lalalalalalalalala, I can't hear you), and I have grown wary of Halo: Reach, so I can come back to my weekly series on Io's volcanoes.  Today, we are discussing Isum Patera, one of Io's more active volcanic centers and the likely source of the largest lava flow field on Io, Lei-Kung Fluctus.

First off, let's get the basics out of the way.  There really isn't a polite way to describe the shape of the volcanic depression that is Isum Patera; it looks like a sperm cell.  Isum is located at 29.82° North Latitude, 208.46° West Longitude. The head of the Isum "spermatozoa" is 62 kilometers (39 miles) in length and 43 kilometers (27 miles) in width.  The southern end of the patera appears to have a greater depth than the rest of the volcano, which can often be indicative of multiple collapses (if formed like terrestrial calderas) or sills embedded in different layers, however the low resolution of our best images of the region (1.3 kilometers or 0.8 miles per pixel), poor phase coverage, and the complex albedo patterns in the area precludes a clear analysis of the topography in this region.  A small mountain may lie along the eastern margin of Isum Patera, though this is difficult to confirm from available imagery.  The "tail" of Isum extends to the northeast from the northern end of Isum Patera.  The tail measures 184 kilometers (114 miles) long and 11 kilometers (7 miles) wide.  The floor of Isum Patera is generally dark green in color, similar to Chaac Patera, suggestive of chemically-altered basaltic lava, though a few spots along the tail of Isum Patera are much darker, more indicative of recent activity.

Isum lies at the center of a multi-colored region along the northern margin of Colchis Regio on Io's anti-Jupiter and trailing hemispheres.  The background color of the area is reddish-brown, typical for Io's plains at this latitude, but it might be enhanced by sulfur deposits from activity at Isum.  Green deposits dominate the terrain to the south and east of the head of Isum Patera, as well as on either side of its tail.  The margins of these deposits are digitate, or finger-like, which is more suggestive of a pyroclasic deposit that a lava flow field, which typically have lobate margins (see Lei-Kung Fluctus to the north of Isum in the image at left, for example).  The most intense of these dark pyroclastic deposits surround the tail of Isum Patera.  Their lack of chemical alteration that results from the interaction between sulfur and the iron in the pyroclastic material suggests they were laid down most recently.  More likely though, they are being covered by fresh material on a regular basis, as their dark albedo has been a constant since the Voyager encounters in 1979.

Volcanic activity has been detected at Isum Patera over a period of 31 years, since it was first observed in 1979 to as recently an adaptive optics observations at Keck Telescope on June 28, 2010.  The first detection of a thermal hotspot at Isum, indicative of on-going volcanic activity, came from the IRIS (Infrared Radiometer, Interferometer, and Spectrometer) instrument on Voyager 1.  It was detected again as a group of hotspots by Galileo's SSI camera when Io was in the shadow of Jupiter in June 1996, June 1997, and November 1997, every time the geometry was appropriate during one of the spacecraft's eclipse observations.  In each case two or three hotspots were detected: at the head of Isum Patera, in the tail, and in the southern portion of Lei-Kung Fluctus.  Galileo's Near-Infrared Mapping Spectrometer (NIMS) also detected a thermal hotspot at Isum Patera during every viewing opportunity during the Galileo Nominal Mission, between September 1996 and September 1997.  It was also seen at high resolution by NIMS in August 2001 (show at right) during a flyby of Io.  NIMS found a line of thermal emission within the middle portions of Isum's tail section.  The intensity of the emission was so great that the NIMS detectors saturated at most of the wavelengths the instrument looked at except the shortest (1.313 and 1.593 μm).  This suggests that both high-temperature volcanism and that large percentages of each pixel that covered the tail region were hot at the time of the observation.

Taken all together, what does the morphology of Isum Patera and its surrounding terrain and its history of persistent, high temperature volcanism with multiple hotspots tell us about the style of volcanic activity going on at Isum?  The distribution of dark pyroclastic material external to Isum and bright and dark patera within the tail region are most similar to Pele, a persistently and vigorously active lava lake.  The thermal emission history is also roughly similar.  In this case, the tail of Isum is a large lava lake whose crust is continuously overturned due to fresh material being brought into the lake from below.  This overturning, which can involve short lasting lava fountains, also permit the release of sulfurous gases and pyroclastic material.  This latter material can then be laid down as dark deposits on either side of Isum's tail.  The tail of Isum Patera may be a fissure that has opened up in Io's crust, allow magma to reach the surface and resupply the lava lake at Isum.  This magma could have also formed a sill at one end of the fissure, which was then later unroofed to form Isum Patera proper.  Another patera may also be located at the northeast end of the fissure, but it isn't clear.

However, some of the evidence can be deceiving.  The global scale images from Galileo that are available of this volcano reveal a curved dark line connecting the northern end of Isum Patera to the southern end of the massive Lei-Kung Fluctus, a large compound lava flow field more than 125,000 sq. km (48,000 sq. mi.) in size.  We know from SSI and PPR measurements from the Galileo spacecraft that at least the southern end of it was still active as of 2002.  A similar relationship between an active patera and a nearby active lava flow field, with a curved dark line between the two, has been noted at other Ionian volcanoes, most importantly at Amirani.  This suggests that Isum Patera may be the source of the largest lava flow field on Io.  In this case, the dark curved line is a lava tube that channels lava from its source in the tail of Isum Patera north to active flow lobes across Lei-Kung Fluctus.  I should point out that that given the huge extent of Lei-Kung, multiple sources can't be ruled out, and given the pattern of thermal emission seen by Galileo's Photopolarimeter-Radiometer (PPR), that's probably likely.

Today, we have looked at one of the most persistently active volcanoes on Io, Isum Patera.  Isum has a rather unique shape for an Ionian volcano.  Regardless, it is the site of rigorous but consistent activity that is suggestive of a large lava lake within the tail end of Isum Patera.  That doesn't preclude the possibility that Isum is also the source (or one of the sources anyway) of Lei-Kung Fluctus, which may act as a kind of release valve for the lava lake, where the overflow from the lake is deposited.

This article is making up for the one I intended to write last Monday so I still need to catch up.  Later this week we'll look at Maasaw Patera, a small volcano seen up close by Voyager 1.

References:
Radebaugh, J. (2005). "Formation and Evolution of Paterae on Jupiter's Moon Io". Ph.D. Dissertation.  University of Arizona.
Lopes-Gautier, R.; et al. (1999). "Active Volcanism on Io: Global Distribution and Variations in Activity". Icarus 140: 243–264. 

Thursday, September 9, 2010

Paper: Detection of a "Superbolide" on Jupiter

A paper was published today online in the Astrophysical Journal Letters on the June 3 fireball on Jupiter.  The impact produced a bright flash that was seen all the way from Earth by two amateur astronomers: Christopher Go in Cebu, Philippines and Anthony Wesley in Murrumbateman, Australia.  We discussed the impact at the time as not one but two detections of this impact were confirmed.  This new paper is titled, "First Earth-based Detection of a Superbolide on Jupiter," by Ricardo Hueso, several co-authors include astronomers who observed the site using Hubble, Keck, and other large telescopes, and the two amateur astronomers who detected the impact.  The paper discusses the circumstances of the observations of this impact, measurements of the energy released and consequently the size of the impactor, and observations by Hubble and other telescopes of the site in the days following the June 3, 2010 impact.

Prior to June 3, 2010, only a few extraterrestrial impacts or meteors had been directly observed.  These included small flashes on the nightside of the Moon, a meteor streak across the Martian night sky by the rover Spirit, the faint flash that Voyager 1 saw in Jupiter's atmosphere, and the Shoemaker-Levy 9 impacts in 1994.  Since June 3, two flashes have been seen in Jupiter's atmosphere, the impact on June 3 that is the subject of this paper and another on August 20 that was observed by several astronomers in Japan.  These impacts produced a brief, bright 2-second flash in Jupiter's atmosphere.  Subsequent observations failed to find the kind of visible scars that had resulted from the larger SL-9 impacts in 1994 and an asteroid impact in 2009.  The discoveries this year by Wesley, Go, and the astronomers in Japan were aided by their use of webcam technology to record their observations of Jupiter.  They sum multiple frames from the videos they record to produce spectacular color images of Jupiter and other planetary targets by reducing the signal-to-noise ratio of their data.  These videos also allow for the detection of transient events like meteor fireballs that might otherwise go unnoticed or unconfirmed with additional observations.

In this new paper, Hueso et al. used the two videos taken by Wesley and Go to measure lightcurves of the June 3 fireball.  By measuring how bright the bolide was compared to the brightness of the area before and after the impact, and by calibrating the photometric response of the filters and camera systems used, the authors were able to estimate the amount of energy released by the meteor.  They estimated that the bolide released 1.0–4.0× 10¹⁵ Joules, or the equivalent of 0.25–1.0 megatons.  This is about 5-50 times less energy than the June 30, 1908 Tunguska airburst, which flattened 2,150 square kilometers (830 sq mi) of forest in Siberia. Bolides with the energy of the June 3 event occur ever 6–15 years on Earth.  Assuming an impact velocity of 60 kilometers (37 miles) per second and a density of 2000 kg per meter, Hueso estimated that the impactor had a mass of 500–2000 tons and was 8–13 meters (26–43 feet) across.  This fits nicely within a gap in our knowledge of Jovian impactors, as the July 2009 asteroid had a mass that was 105 times larger while the meteor that caused the flash seen by Voyager 1 was 105 times smaller.  According to the NASA press release, the August 20 impactor was on the same scale, though that event occurred a month after this paper was submitted.

Analysis of the bolide's optical flash reveals a number of characteristics that are similar to meteors here on Earth.  The lightcurve of the event, which was visible for 1.5 seconds, is asymmetric as the event slowly brightened for one second, produced a bright central flash, then quickly faded.  Analysis of both the blue filter data taken by Christopher Go and red filter data taken by Anthony Wesley also showed that the flash had three distinct peaks, again similar to bolides on Earth.

Anyway, the big result from this paper was the note that observations of Jovian bolides could help place constraints on the impactor (asteroids and comets) flux in the Jupiter system.  Using similar systems as Go and Wesley, Jovian events five times less luminous than the June 3 impact should be detectable as well as events that involving slightly larger impactors on Saturn.  Based on the impacts seen this year, it would appear that models predicting 30-100 collisions of this magnitude on Jupiter, like the dynamical model by Levison et al. 2000, maybe more accurate than those extrapolating from crater counts on the Galilean satellites.  However, as always, more data is need.  More than two data points will be needed to pin the impactor flux down.

For more details, definitely check out the original paper by Hueso et al. over on the European Southern Observatory website from their press release.

References:
R. Hueso, A. Wesley, C. Go, S. Perez-Hoyos, M. H. Wong, L. N. Fletcher, A. Sanchez-Lavega, M. B. E. Boslough, I. de Pater, G. S. Orton, A. A. Simon-Miller, S. G. Djorgovski, M. L. Edwards, H. B. Hammel, J. T. Clarke, K. S. Noll, and P. A. Yanamandra-Fisher (2010). First Earth-based Detection of a Superbolide on Jupiter The Astrophysical Journal Letters, 721 (2) : 10.1088/2041-8205/721/2/L129

Monday, September 6, 2010

Io Volcano of the Week: Shamshu

Each week here on the Gish Bar Times, we profile one of Io's 400 active volcanoes as part of our volcano of the week series.  This week, we take a look at fairly dormant Shamshu Patera, a large patera, or volcanic depression, on Io's leading hemisphere.  If you haven't read it already, be sure to check out last week's volcano of the week, Tvashtar, which we covered in great depth over three articles (Part One - Part Two - Part Three).

As always, let's take care of the basics first about this volcano.  Shamshu Patera is located at 10.1° South Latitude, 63.0° West Longitude, or about 500 kilometers (310 miles) ESE of Hi'iaka Patera, a volcano of the week back in August.  The volcano measures 115 kilometers (72 miles) north-to-south and 107 kilometers (67 miles) east-to-west.  The height of the patera wall which marks the outer edge of the volcano is variable as the surrounding terrain is not constant, the result of debris flows coming off a mountain that abuts the northeastern margin of Shamshu Patera.  Shadow measurements along the northwestern wall of Shamshu show that it is 500 meters (1,640 feet) tall, however the lack of a shadow along portions of its western wall suggest that it maybe less than 50 meters (160 feet) tall in some areas.  Shamshu Patera was named at the IAU General Assembly in August 1997 after a pre-Islamic Arabian sun goddess.

Galileo's best images of Shamshu were taken on February 22, 2000 during its I27 encounter with Io.  I have reprojected the two images that covered Shamshu Patera into a two-frame mosaic, in a simple cylindrical projection with a scale of 350 meters (1,150 feet) per pixel.  This mosaic covers all of Shamshu Patera, right of center, as well as Shamshu Mons to the west and portions of two other mountains: one abutting Shamshu Patera to its northeast and another a little farther away to the southeast.  For a look of color in this region, see the map above as well as a global view from June 1997.

A few obvious features stand out about Shamshu Patera.  The volcano's floor is dominated by dark lava flows of varying albedos.  The different levels of brightness of its flows suggest that different eruptions produced new flow lobes that covered a different potion of its floor.  As the lava flows age, they cool and all more sulfur dioxide and sulfur to condense on their surfaces.  So as they age, the lava flows slowly brighten.  Despite how dark many of these lava flow lobes look, I can't see any evidence for surface changes at Shamshu during the Galileo mission, so either very little SO2 is deposited here, or they maybe persistently active.  More on that in a bit.  The shape of Shamshu's dark material, and the more central location in the patera, is more consistent with these resulting from lava flows rather than this volcano being a lava lake, like Pele or Loki.  About half of the patera of covered in material that has the same brightness as the surrounding Ionian plains and has a brighter orange color.  These areas likely haven't seen lava flows in recent times (> 100 years) or may have been coated in sulfur.

Just outside of the Shamshu's walls, a number of apparent bright flows are visible.  To the west of Shamshu, these bright deposits are correlated with the margins of the debris flow that came off the mountain to the northeast of the volcano.  That's right, I said margins, because layers are apparent within the edge of the debris flow.  The visibility of layers combined with the presence of bright material correlated with the scarps that mark the edge of these layers suggest that they are eroded by sulfur dioxide sapping.  The presence of layers in the debris flow (if that's what this is) would also mean that the landslide materials are remarkably well sorted with a mix of basalt/sulfur and sulfur dioxide layers.  A very bright flow is visible along the southern edge of Shamshu Patera, either the result of a sulfur flow, or, more likely, a silicate lava flow whose surface has been chemically altered.  Something odd is going on here because this flow is quite bright, so bright that from distant imaging, it almost looks like it should be the southern margin of Shamshu Patera.

As far as current volcanic activity, Shamshu was observed by the Galileo Near-Infrared Mapping Spectrometer (NIMS) as an active hotspot on only one occasion, during orbit C10 in September 1997.  The region was observed on several occasions before and since by Galileo and by New Horizons in 2007 and no additional activity was detected.

Next week, we will shift our focus from this fairly quiescent (at least in the present epoch) volcano to the more active Isum Patera on the opposite side of Io.

References:
Bunte, M.; et al. (2010). "Geologic mapping of the Hi’iaka and Shamshu regions of Io". Icarus 207: 868–886. 

Friday, September 3, 2010

The Remains of the Week

Here is a wrap-up of outstanding issues from this week:
  • Ted Stryk requested that I include the C3 and C21 data covering Tvashtar to my comparison chart in order to provide a longer baseline from which to look at surface changes.  Ted, ask and ye shall receive:
   
C3ISTOPMAP01 - 11/06/199621ISALBEDO01 - 07/02/199925ISGIANTS01 - 11/26/1999
   
27ISTVASHT01 - 02/22/200032ISTVASHT01 - 10/16/2001Surface Changes at Tvashtar

Thursday, September 2, 2010

Jupiter: Past and Present

This week, two of the best images of Jupiter that I've seen in a long time were published online.  One is a blast from the past, as Björn Jónsson released a mosaic he has been working on based on Voyager 1 data.  The other is simply the best image of Jupiter I have ever seen taken from by an astrophotographer.

First up is a 12-frame mosaic covering the Great Red Spot and surrounding cloud features. The original data was taken by the Voyager 1 spacecraft the day before its famous encounter with the Jupiter system, and Io in particular.  This mosaic was created by Björn Jónsson, who also created another 12-frame mosaic from Voyager 1 data a couple of weeks ago, covering a larger area of Jupiter's southern hemisphere.  His processing techniques bring out small-scale details in Jupiter's cloud features, accounts for Jupiter's rapid rotation, and preserves color contrasts without over-saturating the colors (that often plagued Voyager image processing that was performed at the time of the encounter).  This gentler approach to the data set allows Jónsson to bring out features such as shadows cast by high, convective clouds on the main cloud decks below.  While the Great Red Spot has certainly changed in the 31 years since these images were taken, these remain some of the best color images ever acquired of this giant storm, as Cassini was too far away to acquire high-resolution data, Galileo lacked the bandwidth, and New Horizons' high-resolution camera has only a single bandpass.

According to Jónsson, "the images I used were obtained on March 4,1979 at a distance of about 1.85 million km. The first image (C1635314.IMQ) was obtained at 07:08:36 and the last one (C1635400.IMQ) at 07:45:24. The resolution is roughly 18 km/pixel."  He used orange and violet filter data combined with a synthetic green filter.

Bringing us back to the present, Anthony Wesley, who is still out at Exmouth in Western Australia, was able to take a spectacular image of Jupiter on August 30.  The extraordinary quality of his data were the result of excellent viewing conditions.  What makes this image so remarkable is not so much its resolution, but its contrast.  For example, you can clearly make out a pattern of waves created by turbulence between the faded South Equatorial Belt and the South Tropical Zone to the west of the Great Red Spot.  Because both bands are bright, a high level of contrast is needed to pick out this kind of detail.  At the time this image was taken, the Great and Little Red Spots were reaching their closest approach, with only limited signs of interaction between the two orange storms.  Features are also visible within the Great Red Spot, again feat made possible by the incredible image contrast.  Not shown are two bright ovals in the North Equatorial Belt that merged on August 28.  Luckily, amateur astronomers were able to catch this merger as it happened, showing them get closer over the last few weeks before spinning around each other and merging.

Wednesday, September 1, 2010

Io Volcano of the Week: Tvashtar - Part Three

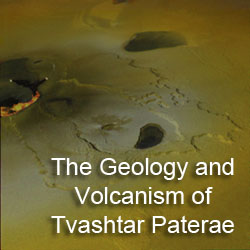
Over the last few days, we have focused on the geology and volcanic history of Tvashtar Paterae, a string of four volcanoes located within Io's high northern latitudes.  During the Galileo mission, Tvashtar was the site of several volcanic eruptions between November 1999 and October 2001, including a large, sulfur-rich plume that was seen by Cassini during its brief flyby in late December 2000.  Since the end of the Galileo mission in 2003, monitoring of active volcanism on Io was limited to intermittent data taken at ground-based telescopes like the European Southern Observatory in Chile, Keck II, and IRTF in Hawaii.  In addition, in late February 2007, the Pluto-bound New Horizons spacecraft flew by Io from a distance of 2.26 million kilometers (1.4 million miles), allowing the cameras on-board to search for surface changes on the moon since it was last seen five years earlier.  Today, we will discuss the volcanic activity seen at Tvashtar since the end of the Galileo mission as what this volcanic history tells us about the variety of eruption styles exhibited by the volcanoes of Tvashtar and how their lavas are fed.

Don't forget to check out the previous two parts of our series on Tvashtar Paterae, if you haven't already done so!  Part One - Part Two.  This article is also part of our broader series where we examine one Ionian volcano each week.

The Tvashtari Reawakening
Throughout the 2000s, Io was imaged on numerous occasions using the adaptive optics system at the European Southern Observatory and Keck II telescopes.  These two large telescopes use adaptive optics to partially correct for atmospheric effects on data acquired at these telescopes.  Much of the data acquired of the Tvashtar region since of the end of the Galileo mission has been taken at the Keck II, 10-meter telescope at Mauna Kea in Hawaii.  Other facilities have been used, of course, to monitor Io's active volcanism, but they often use techniques that only work for Io's Jupiter-facing hemisphere, on the other side of the moon from Tvashtar.  After correcting for atmospheric effects, researchers using Keck II to observe Io can achieve a spatial resolution of 120 kilometers at near-infrared wavelengths.  Unfortunately, because time on this one telescope is very limited, only a few nights each year were available to observe Io, and when you combine the possibility of inclement weather at Mauna Kea and the fact that Tvashtar wasn't always on the visible hemisphere, you can tell that there weren't many opportunities to observe Tvashtar.  As far as I can tell from what has been published and what is online, between the [effective] end of the Galileo mission and the New Horizons flyby, the Keck group, which includes Franck Marchis, Imke de Pater, and Conor Laver, observed Tvashtar on: 12/22/2001, 12/26/2001, 03/08/2003, 05/29/2004, 04/17/2006, and 06/02/2006.  Between at least December 2001 and May 2004, Tvashtar was not seen in Keck data.  This suggests that it had become quiescent enough to not have any lava hot enough to produce detectable thermal emission.

However, the data from 2006 showed that Tvashtar had cut short its vacation and became more active.  Intense thermal hotspots were observed at Tvashtar during observing runs on April 17 and June 2, 2006. The emitted power seen on June 2, the higher resolution of the two runs, was 7.7 ± 0.9 × 10¹² W, more than twice that seen at Pillan during its eruption in 1997, but still an order of magnitude less power than released at the most powerful volcanic eruption ever seen by humans, the Surt eruption in February 2001.  Laver, de Pater, and Marchis published their data a year later, finding a blackbody temperature of 1240 K for June 2 data.  This measurement was aided by the use of the then-new OSIRIS camera at Keck, which acquires high-spectral resolution data for each pixel, much like NIMS on Galileo, VIMS on Cassini, and CRISM on the 
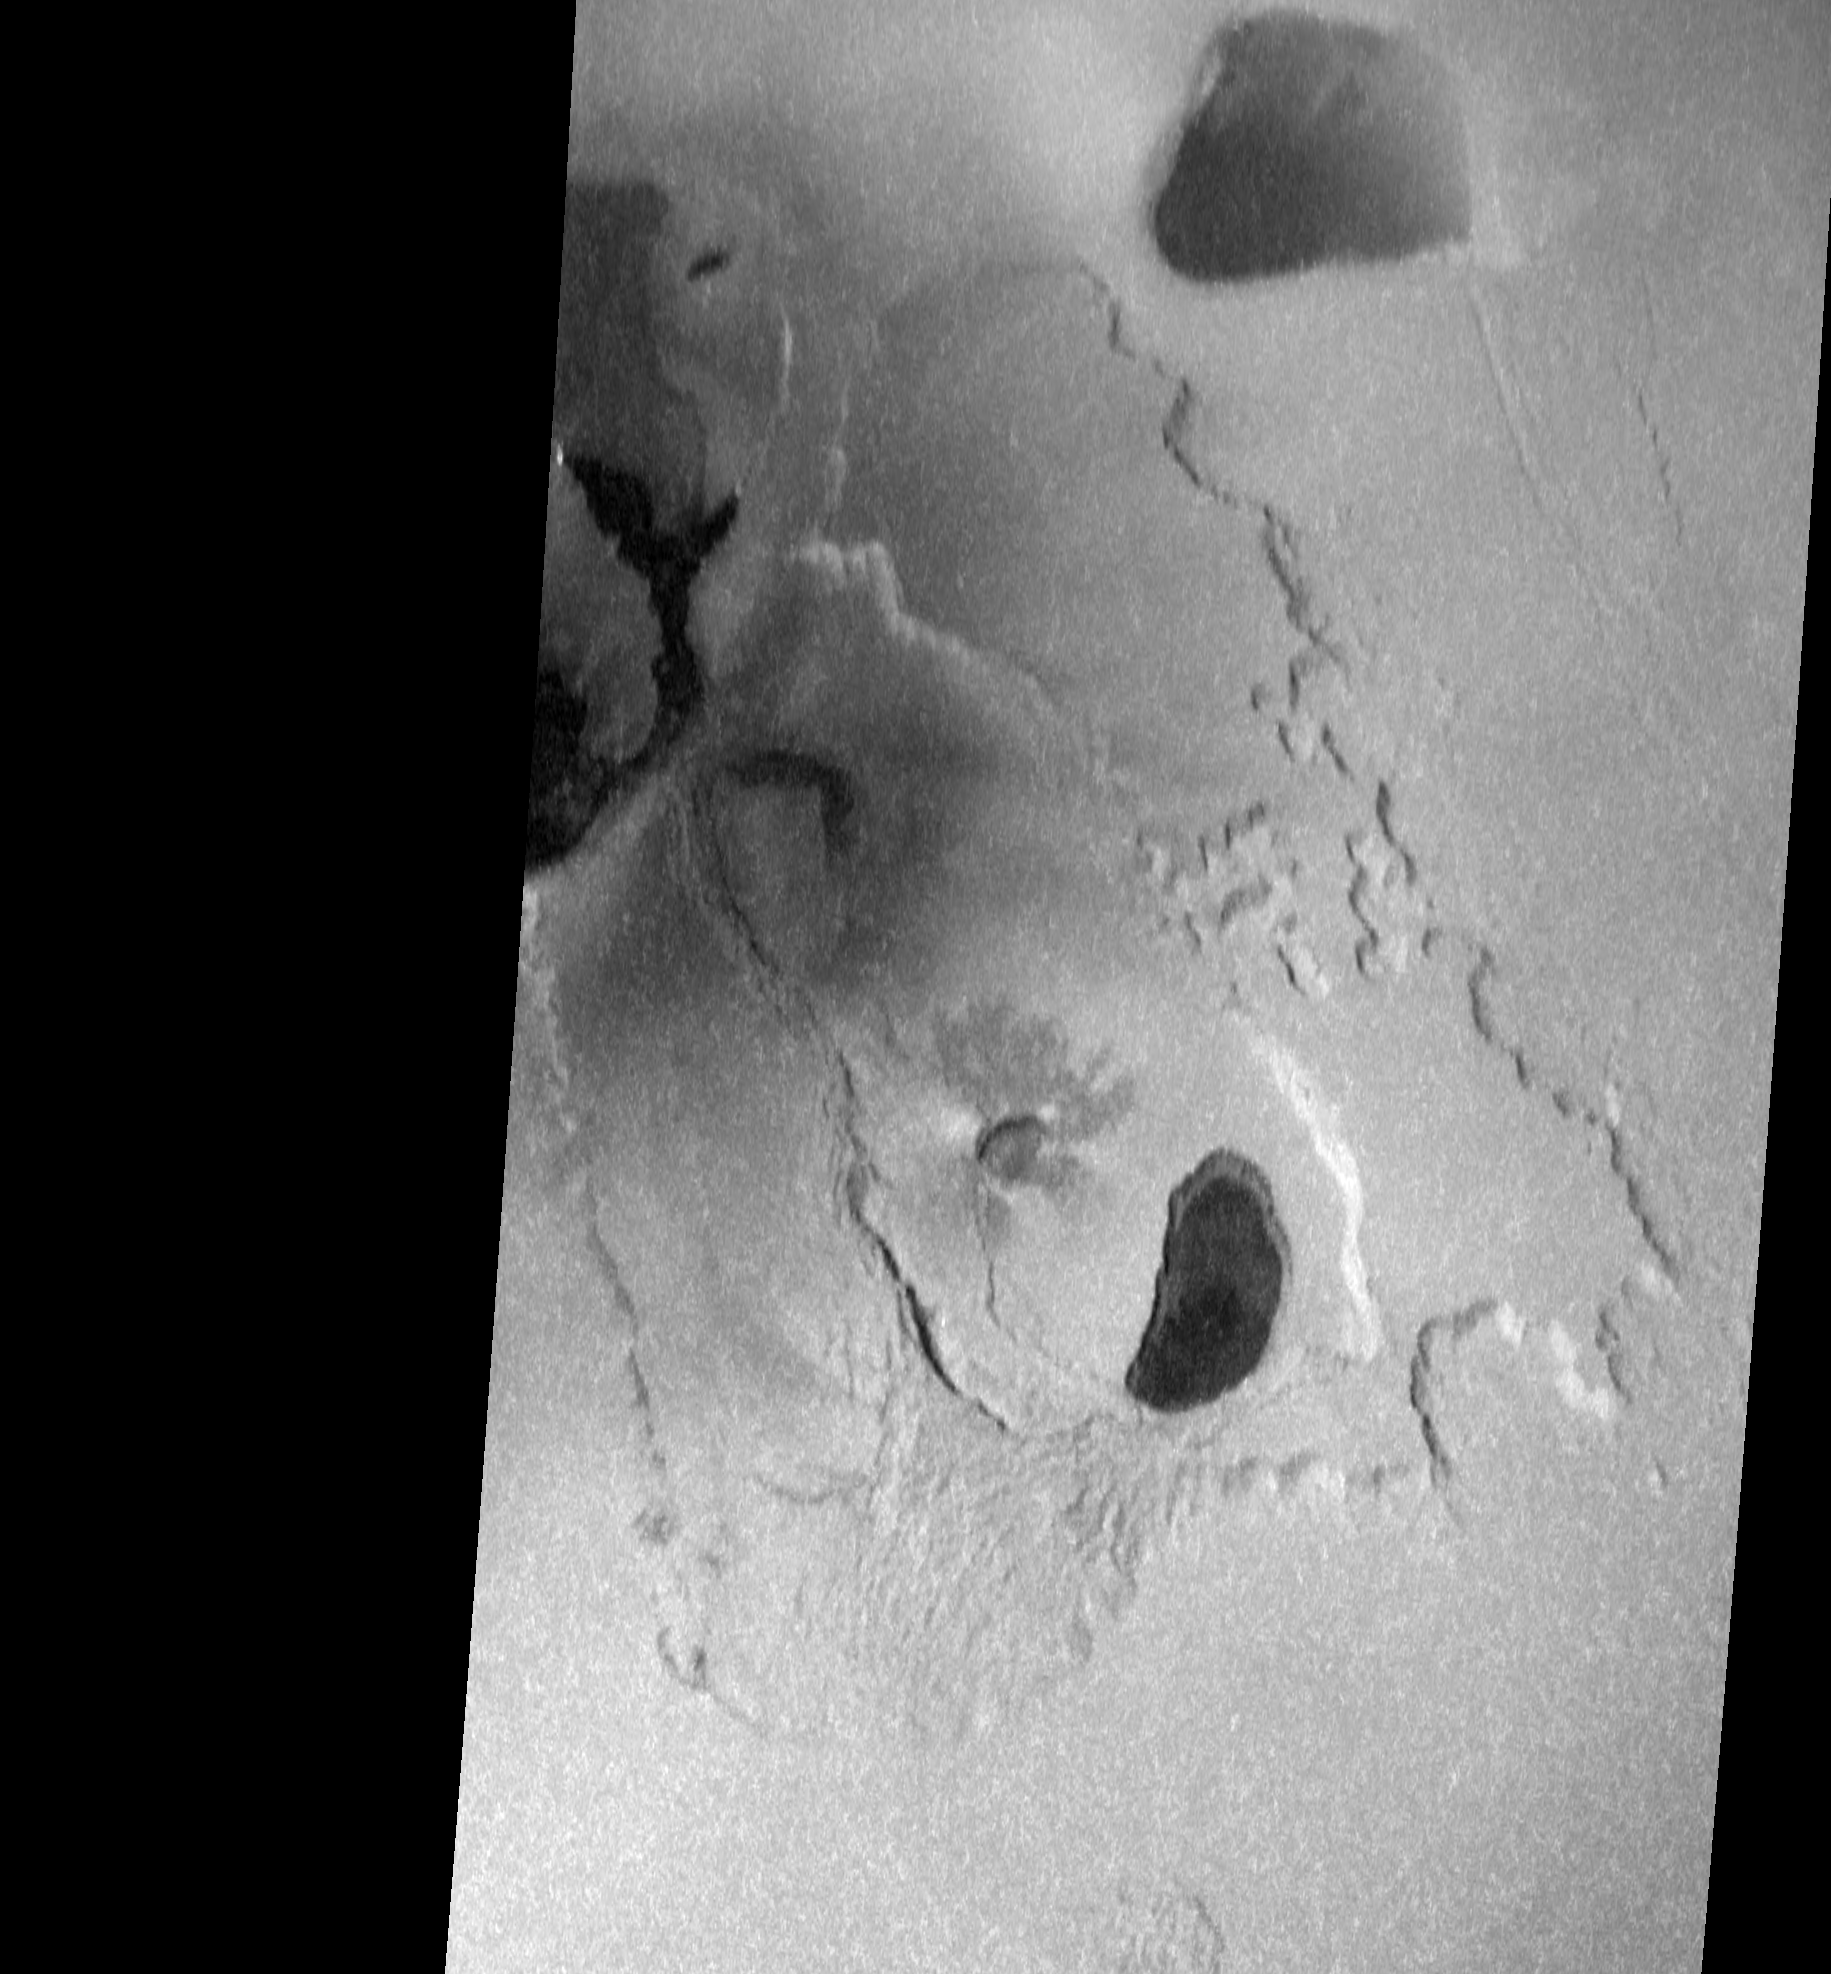
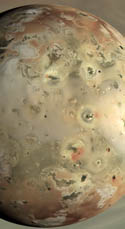
Mars Reconnaissance Orbiter.  Comparison between images like those at left with a Galileo/Voyager basemap revealed that the hotspot was centered at 59 ± 1 N, 121.5 ± 1W, placing Tvashtar C within the error box [see the map I posted yesterday for the letters used for the different volcanoes at Tvashtar].  The area covered by this basaltic lava was estimated at 57 km2 (14,100 acres), consistent with the size of Tvashtar C.  However, given the size of the hotspot and the resolution of the available data, it is not impossible that it was located a bit farther to the north, at Tvashtar B (the site of the November 1999 and December 2000 outbursts).

Operation: New Horizons
A few months before Tvashtar re-awakened, the New Horizons spacecraft was launched from Cape Canaveral, bound for the then-most distant planet in the Solar System, Pluto.  To get all the way out to that distant world in a timeframe that wasn't ridiculously long, the spacecraft was launched on the fastest trajectory of any interplanetary spacecraft, and even then it required a gravity assist at Jupiter to fine-tune its path and to boost its velocity to get out to Pluto in 2015.  This gravity assist at Jupiter took place on February 28, 2007, providing an opportunity to test the spacecraft's instruments on the many worlds of the Jupiter system.  More than 190 images were acquired during this encounter of Io by LORRI, a high-spatial resolution camera system with a single, broadband band pass.  Additional data was taken by MVIC, a lower-spatial resolution, 5-filter camera that covers visible and near-infrared wavelengths, and LEISA, a near-infrared mapping spectrometer.

A couple of weeks before New Horizons made it closest approach to Jupiter and Io, John Spencer and Kandis Lea Jessup observed Io using WFPC2 on the Hubble Space Telescope.  Images taken on February 14 and a week later on February 21 revealed a large plume over Tvashtar Paterae, not unlike the one seen by Cassini in December 2000.  While the plume was only seen in ultraviolet filter images, it was hoped that the plume would still be visible at high angles in New Horizons images.

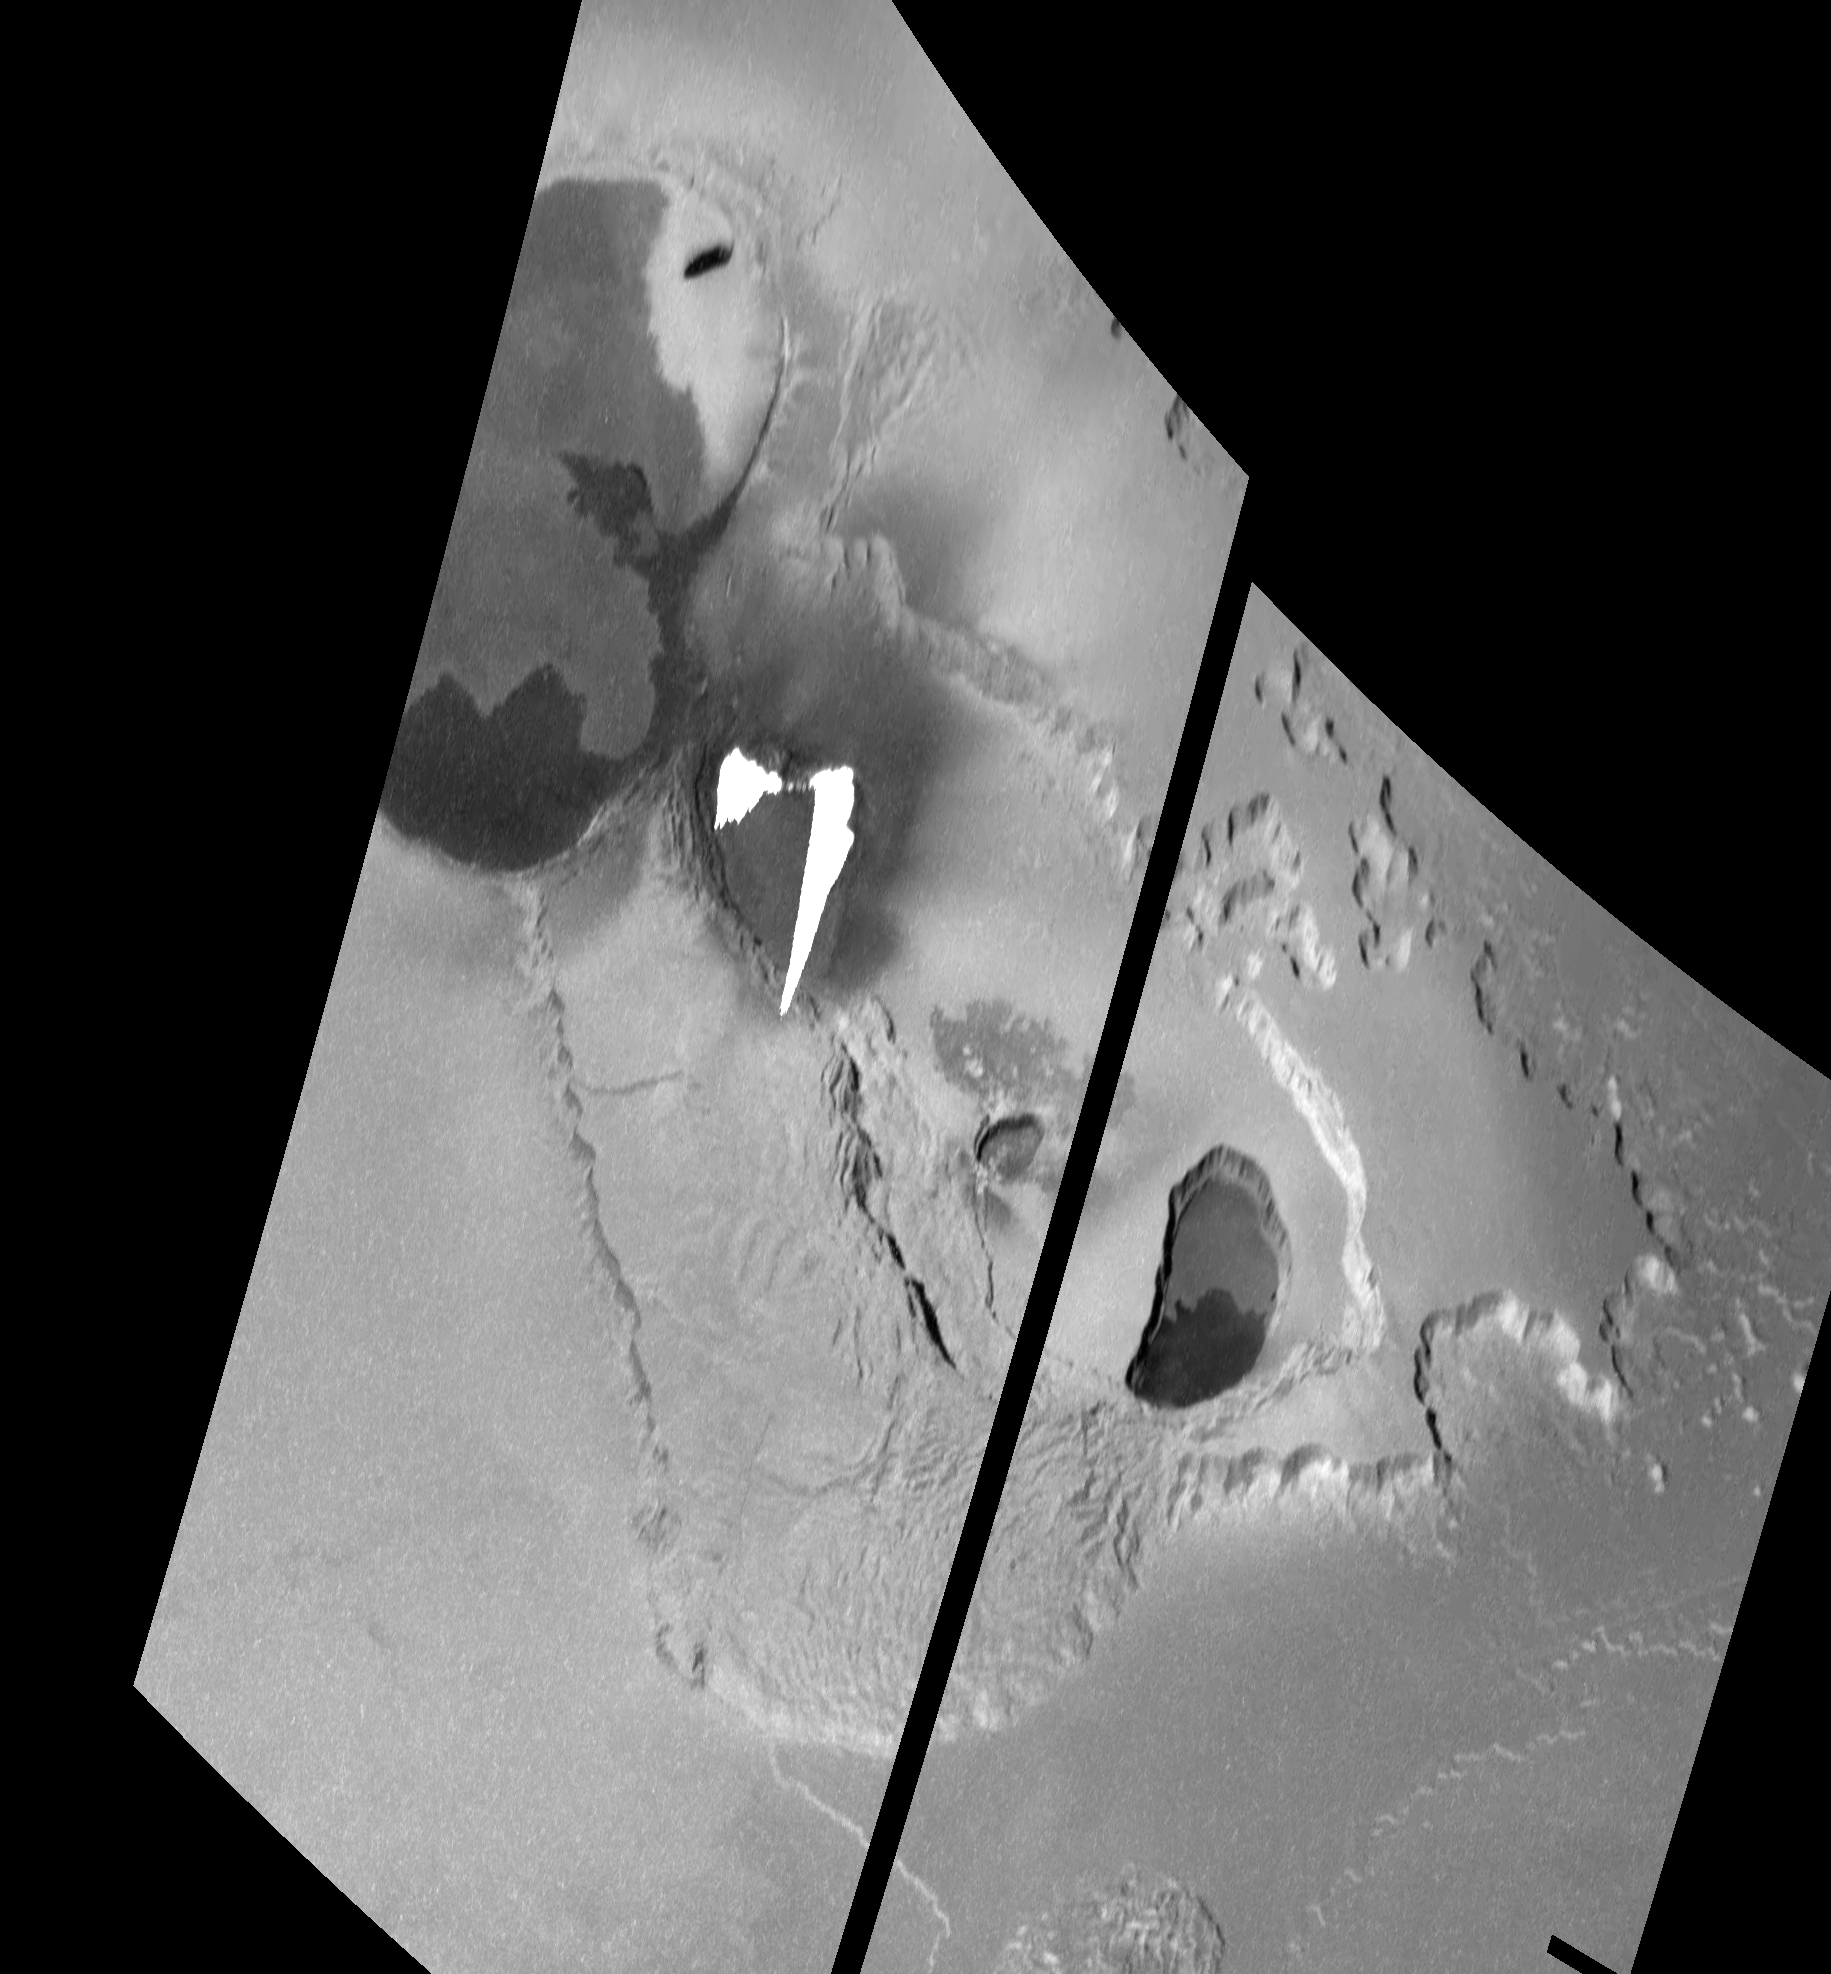
When New Horizons started imaging on February 24, 2007, it turned out to be even better than that.  A large volcanic plume, 350 kilometers (220 miles) in height, was visible in early, low-phase angle images of Io.  The near-polar position of Tvashtar also meant that the plume was visible in nearly every image taken by New Horizons.  This data also revealed a new red ring deposit surrounding Tvashtar Paterae as a result of this plume.  In one case, repeated imaging over the course of eight minutes allowed John Spencer and his group to track clumps within the plume as they descended from the crest of the plume to the surface.  Their motions are consistent with sulfur and sulfur dioxide gas condensing at a shock front at the top of the plume (rather than dust particles rising with expanding gases, like at Prometheus), then descending as it flows down along the shock flow front.  The clumps likely form from electrostatic forces either generated by the interaction of plume particles (doubtful considering the spacing between individual grains) or from electrons brought in by Jupiter's magnetic field or the flux tube that connects Jupiter and Io.  The fact that the plume was so easily visible in LORRI and MVIC images suggests that plume contained more dust than other giant plumes like Pele's or the Tvashtar plume seen in 2000.

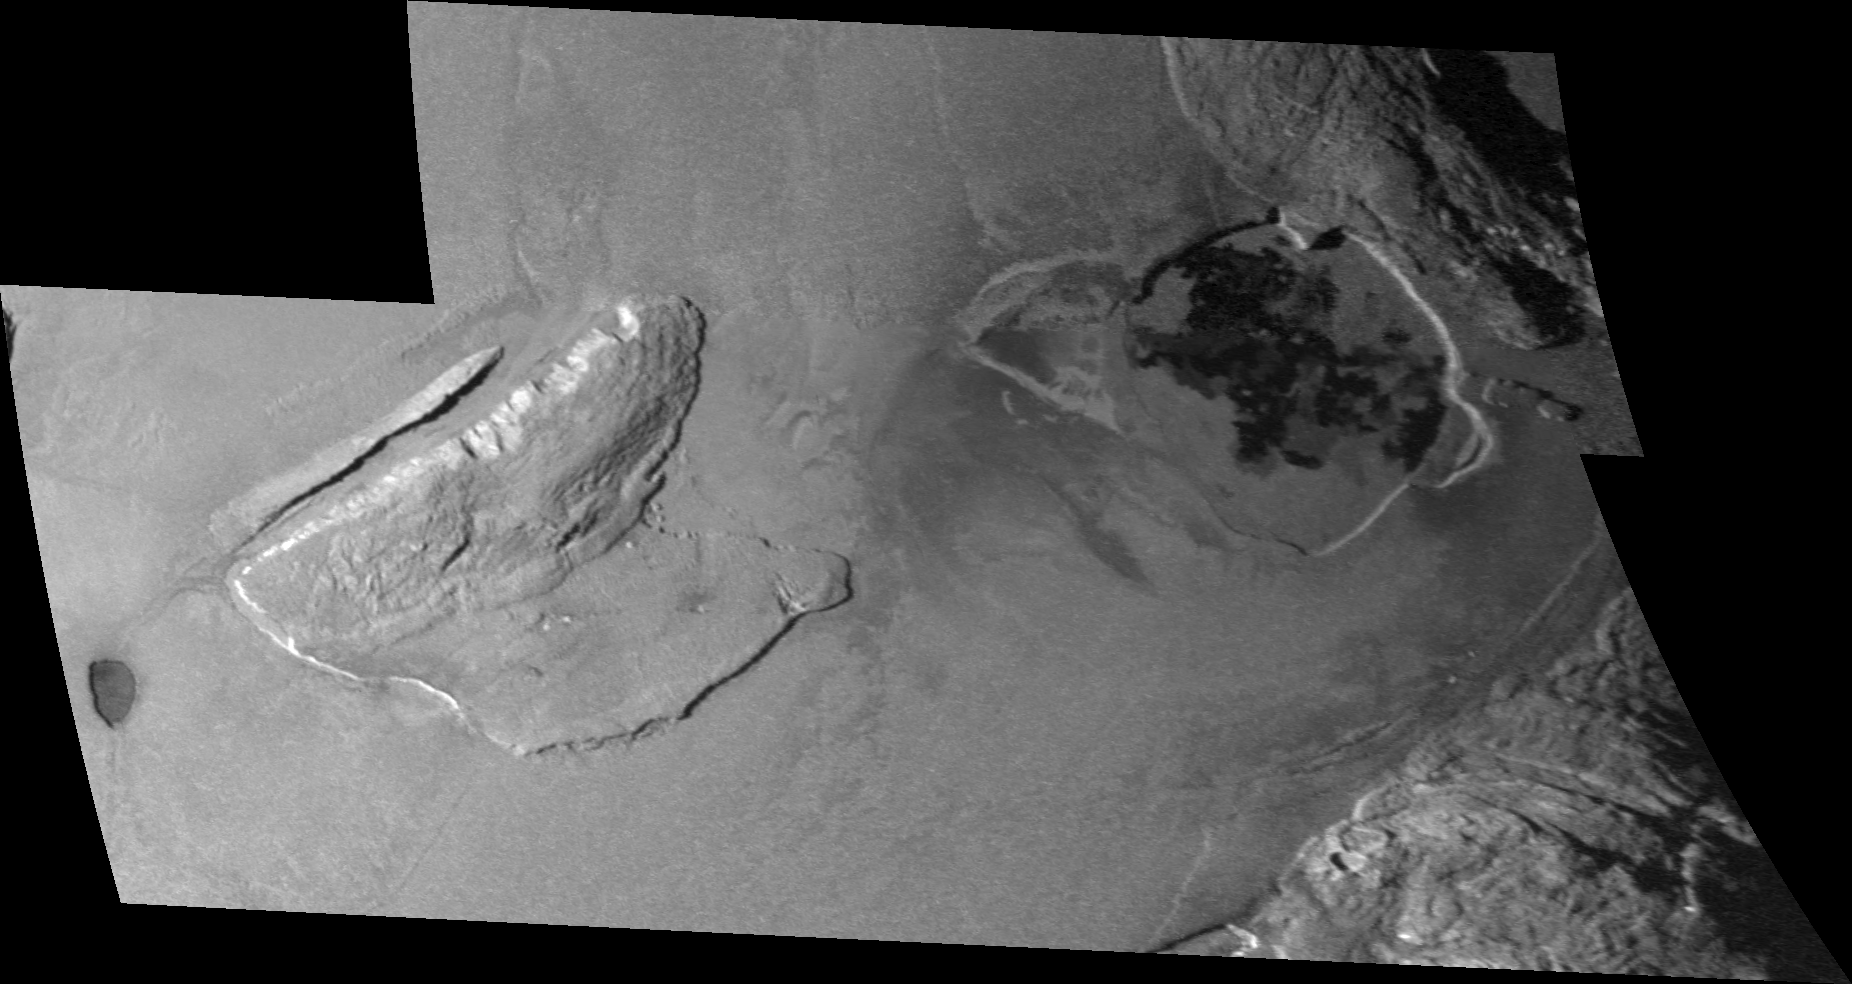
A thermal hot spot was also seen at Tvashtar by all three cameras on New Horizons (neglecting ALICE since it barely resolved Io).  The high-resolution data acquired by LORRI (~10-20 kilometers per pixel) allows the eruption site to be determined, corresponding with the southern half of Tvashtar B.  This was also the site of the December 2000 outburst that also produced a large volcanic plume and high thermal emission.  Using the LEISA spectrometer, temperatures around 1250 K were found, though the detection of a hotspot in daylight images with the visible light LORRI would suggest that higher temperature components are likely as part of an active lava fountain or curtain.

Eruption styles

The volcanic eruptions seen at Tvashtar since 1999 suggests that certain volcanoes experience specific eruption styles.  For example, Tvashtar B was the site of three, maybe four, large outburst eruptions over a period of a little over seven years.  Each of these eruptions involved lava fountains that generated intense thermal emission, even at visible wavelengths.  The 2006 eruption by itself generated about 7% of the total power output of all of Io's volcanoes put together.  That eruption may have occurred at the small Tvashtar C patera instead, but no prior eruption had been seen there except for some faint thermal emission seen by NIMS in August 2001.  Based on observations of the 1999 eruption, these eruptions don't last very long, less than three months, or transition from one type of eruption to another, as the lava fountaining phase transitions to open lava channels flowing out across the surface, and later to one dominated by insulated flows where lava is transported through lava tubes, limiting the visibility of hot lava to remote sensing.  Dark diffuse deposits surrounding Tvashtar B show these lava fountains also generated pyroclastic flows consisting of basaltic tephra.  This eruption style is reminiscent of large, explosive volcanic eruptions on Earth, like Laki in 1783.

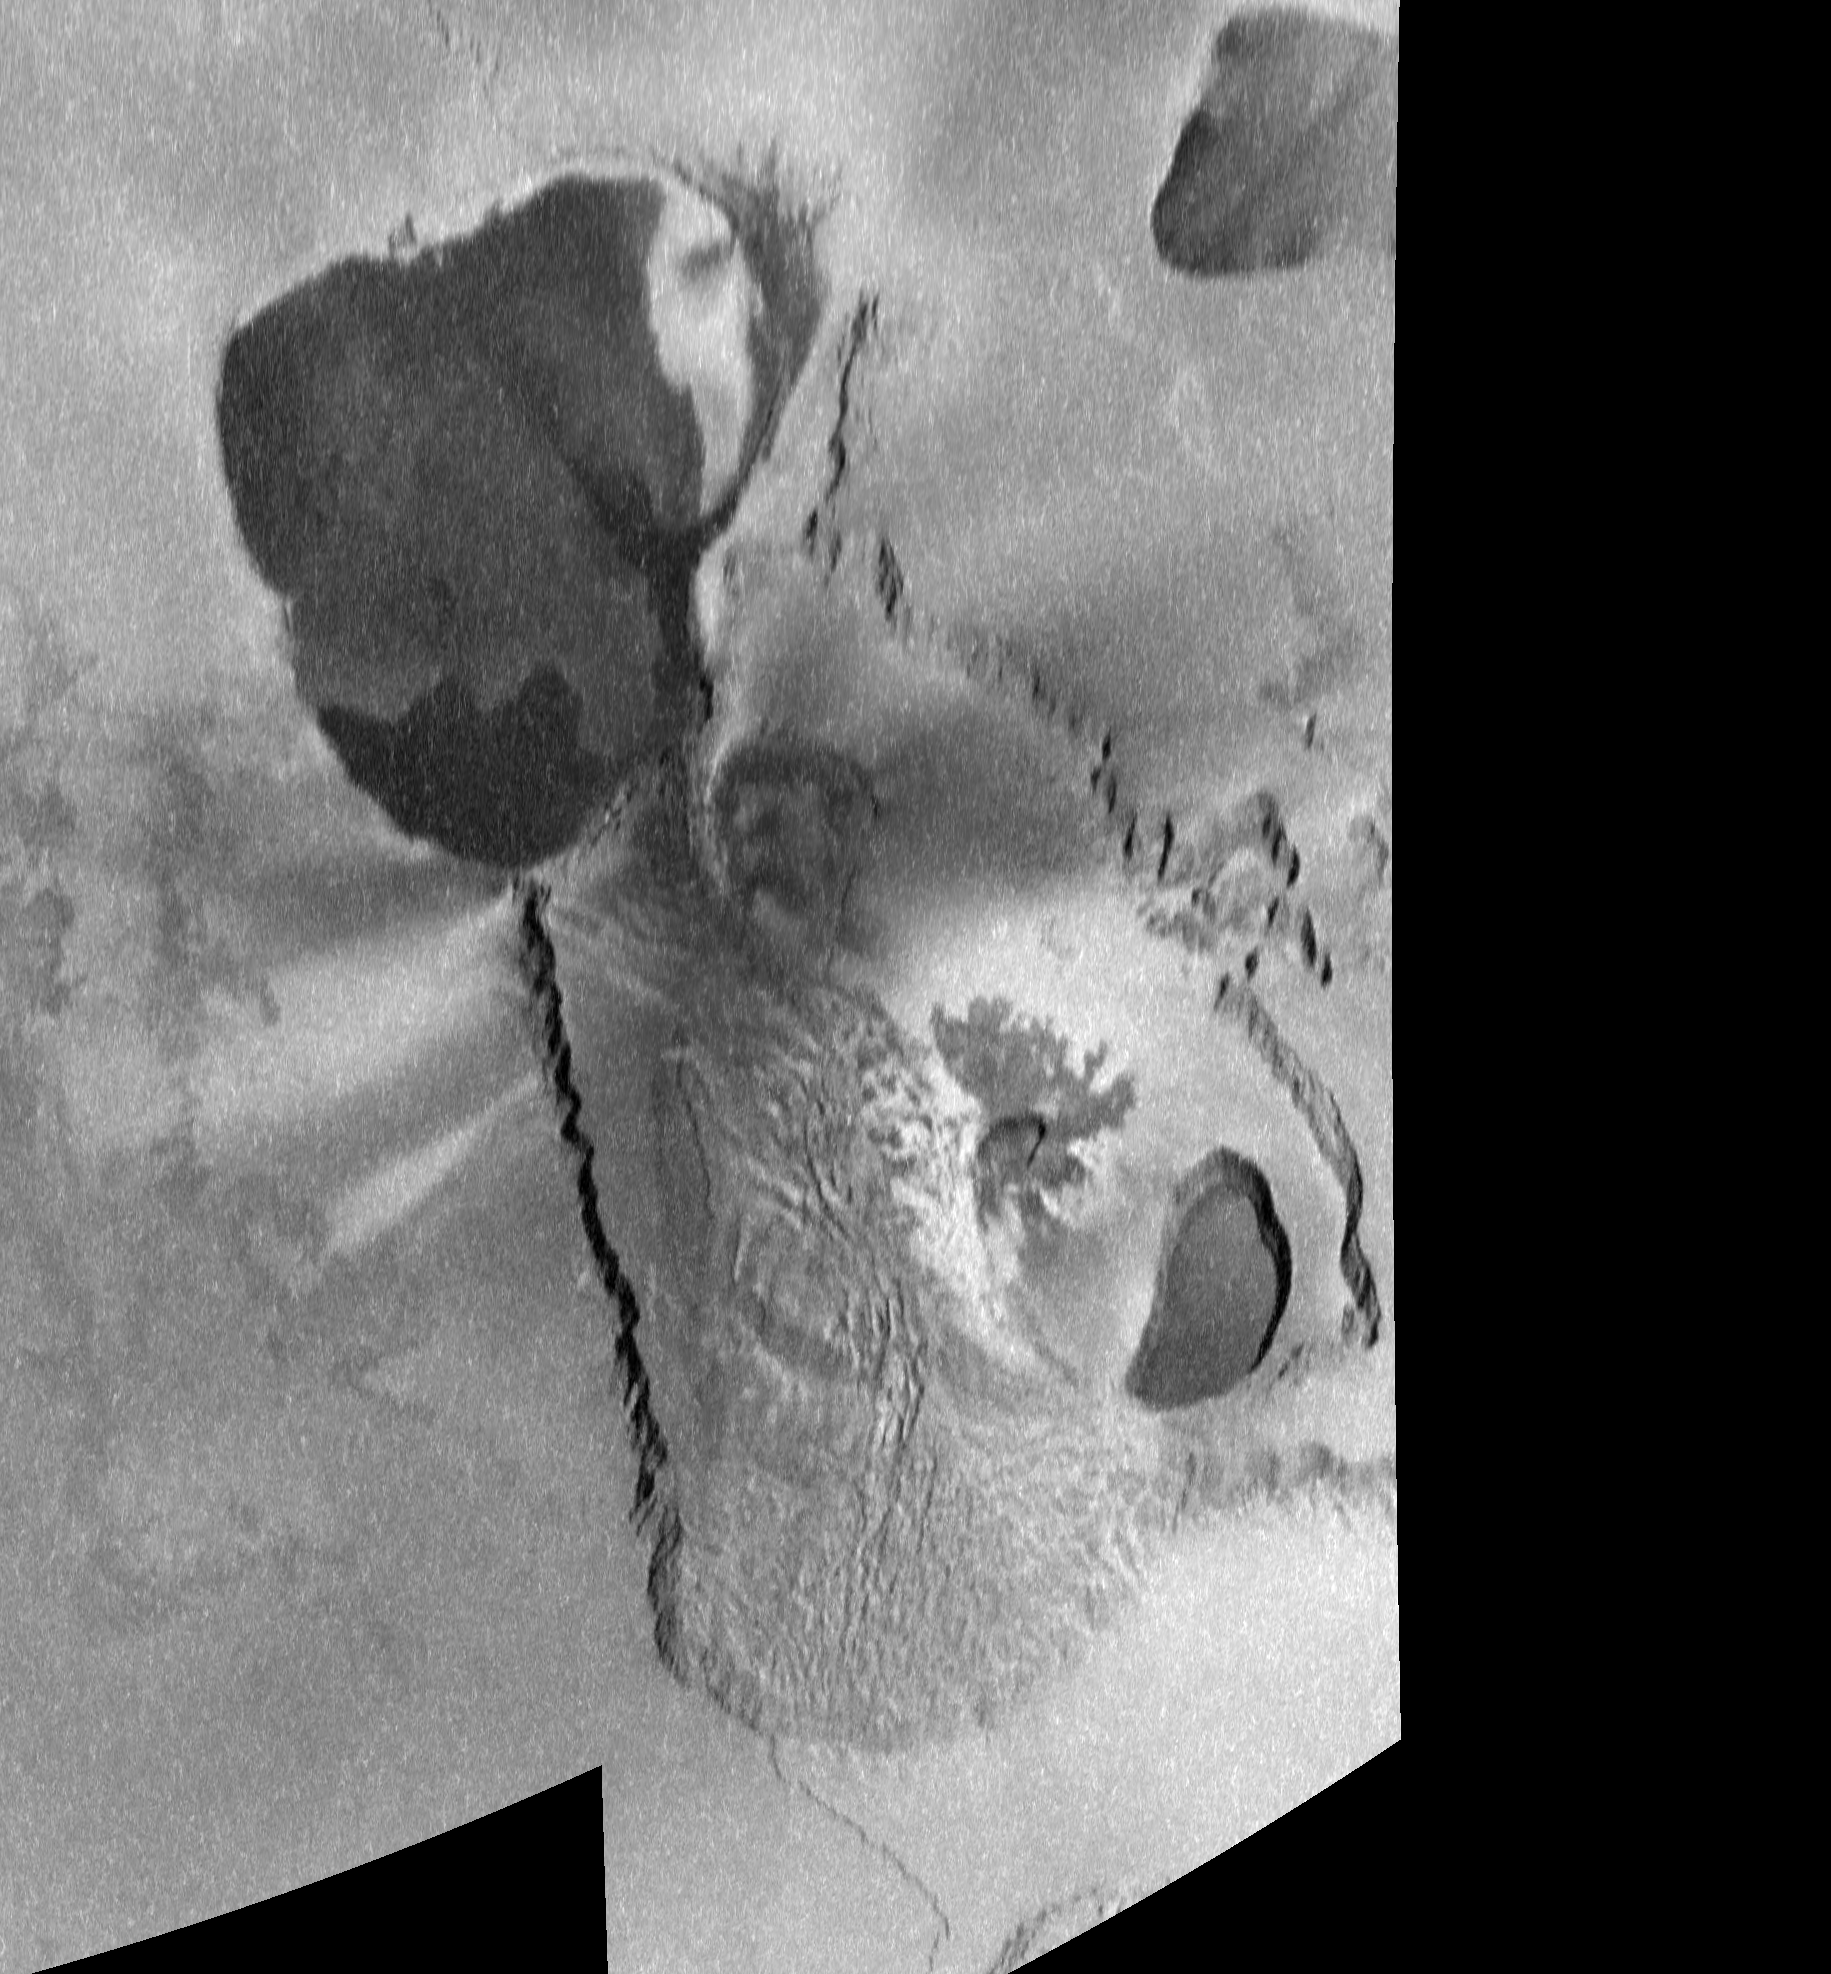
At Tvashtar A, a large, dark whale-shaped volcanic region dominates.  It is uncertain based on the current data if this region is a large lava lake that is only intermittently active or is an insulated lava flow that is again, only occasionally active.  Only one unambiguous eruption was been detected at Tvashtar A in February 2000, with a pair of hot vents and a broad area of hot lava.  Same story for Tvashtar D, though there is no evidence it has been active in the recent past.  A region of dark basaltic lava had brightened between February 2000 and October 2001 showing that it was cool enough to allow sulfur and sulfur dioxide from the eruption at Tvashtar B to condense on it.

The awakening of Tvashtar since 1999 is likely the result of magma from a deep source at a depth of 30 kilometers (19 miles) that has become active again.  Its depth, in addition to help feed massive lava curtains, can also allow it to feed magma to multiple volcanoes.  That's why you can see one eruption at Tvashtar B and a few months later an eruption can get started up at Tvashtar A.  A similar situation was seen after the Thor eruption in August 2001.  Small volcanoes nearby, which had also never been seen as active before 2001, came out of dormancy at about the same time.  Kami-Nari experienced a phreato-magmatic eruption two years after the nearby Pillan eruption.  Io's heavily fractured lithosphere can facilitate the movement of magma from these deep reservoirs to either shallow magma reservoirs (likely the case for Tvashtar A and D) or directly to the surface as dikes during intense, outburst eruptions (the case for Tvashtar B, maybe C too).  The latter case can also transition to the former, as the dikes also feed sills below the volcano.  These sills can later grow into shallow magma reservoirs.  These provide a more consistent source of lava that can support persistent eruptions like Prometheus or Amirani.

Conclusion

Tvashtar is one of the most well imaged volcanoes on Io with three sequences at spatial scales between 183 and 315 meters (600-1,033 feet) per pixel.  This imaging permitted Galileo researchers to study an outburst eruption up-close and changes in the distribution of pyroclastic deposits and lava flows as a result of these intense eruptions.  The geology of this region is also intriguing, with a large plateau surrounding much of Tvashtar Paterae. This plateau is marked by evidence of sapping that has eroded the plateau back, in some cases forming canyons 40 kilometers (25 miles) long.

Next week's volcano of the week is Shamshu Patera, a volcano with not nearly as intense eruptions of Tvashtar.  Over the next month, we will also look at Isum, Maasaw, and Loki.  While Maasaw has been fairly quiet, both Isum and Loki have had very unique eruption styles that will be interesting to examine.

References:
Leone, G.; L. Wilson. (2001). "Density structure of Io and the migration of magma through its lithosphere". Journal of Geophysical Research 106 (E12): 32,983–32,995. 
Spencer, J.; et al. (2007). "Io Volcanism Seen by New Horizons: A Major Eruption of the Tvashtar Volcano". Science 318 (5848): 240–243.
Laver, C.; et al. (2007). "Tvashtar awakening detected in April 2006 with OSIRIS at the W.M. Keck Observatory". Icarus 191: 749–754.