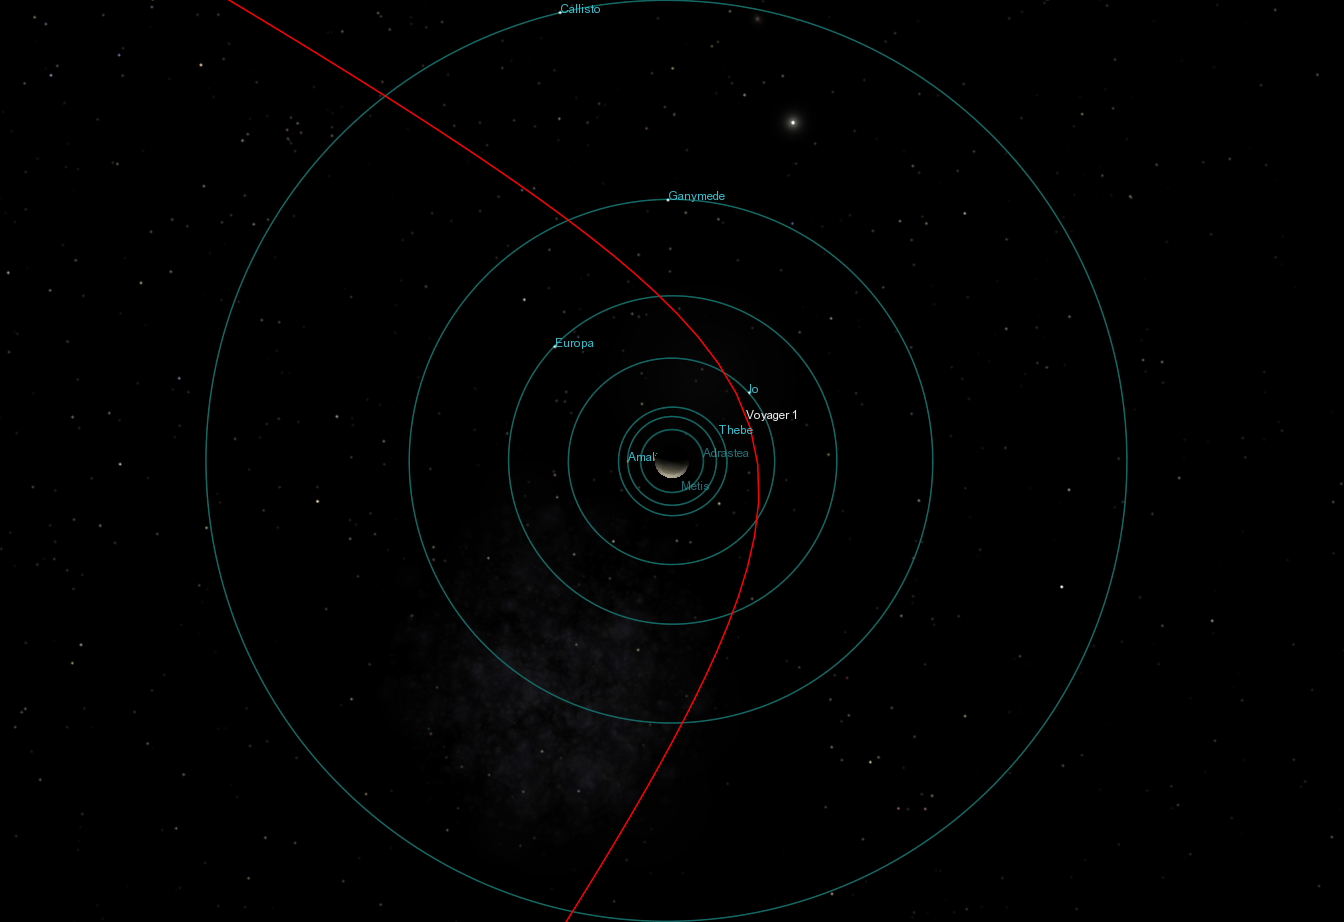
One technique scientists use to monitor Io's active volcanism and atmospheric processes is by observing the moon while it is in eclipse. Every Io day, the satellite passes into the shadow of Jupiter for a period of 2 hours and 20 minutes, plunging the entire moon into darkness. But as first faintly seen by the
Voyager 1 spacecraft when it flew by in 1979, Io glows in the dark. These glows come from a variety of sources on Io's surface and atmosphere, such as thermal emission from lava flows and lava lakes, and aurorae from the interaction between gases in the atmosphere and Jupiter's magnetic field. In this article, we will explore what scientists can learn from observing Io while in the darkness of Jupiter's giant shadow.
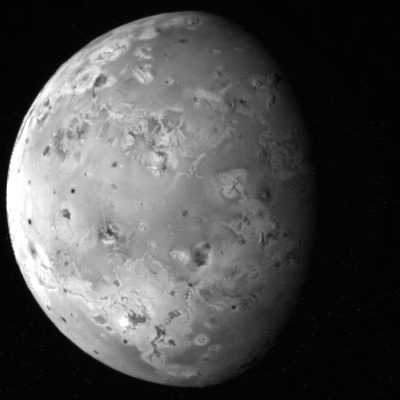
A few hours after its flyby of Io on March 5, 1979,
Voyager 1 observed the moon while it was in eclipse. It was a very long exposure, wide-angle-camera image designed to capture the night-side of Io against the background of stars at the end of the encounter. The image contained multiple exposures of the night-side with a camera slew between each exposure. It (FDS 16395.39, PICNO 0376J1 + 000) revealed a number of faint glows across Io.
Cook et al. in 1981 examined this image, and found that most of the faint glows, smeared as they were by the multiple exposures, were related to the plumes detected in
Voyager 1's daylight images of the satellite, including faint flows from Pele, Marduk, Amirani-Maui, Prometheus, and Volund. The poles of the moon were also faintly illuminated, with the north pole being a bit brighter than the southern one. No thermal emission from Io's volcanic hot spots were observed on this occasion because the vidicon sensors used by the
Voyager camera system could not detect photons with wavelengths longer than the orange portion of the visible spectrum. This is much too short to detect thermal emission from all but the hottest of volcanic eruptions. Cook
et al. concluded that the glowing gases were not the result of extremely hot plasmas, but were glowing due to being excited by electrons from Jupiter's magnetosphere. They suggest, however, that the polar glows are the result of gases emitted from numerous small vents, as opposed to plumes, which as we shall see from
Galileo's results, may not be the correct interpretation.

The
Galileo spacecraft arrived at Jupiter 16 years after the
Voyager encounters, and stayed to observe Io every few months until its eventual destruction in Jupiter's atmosphere in September 2003. On
Galileo's first orbit,
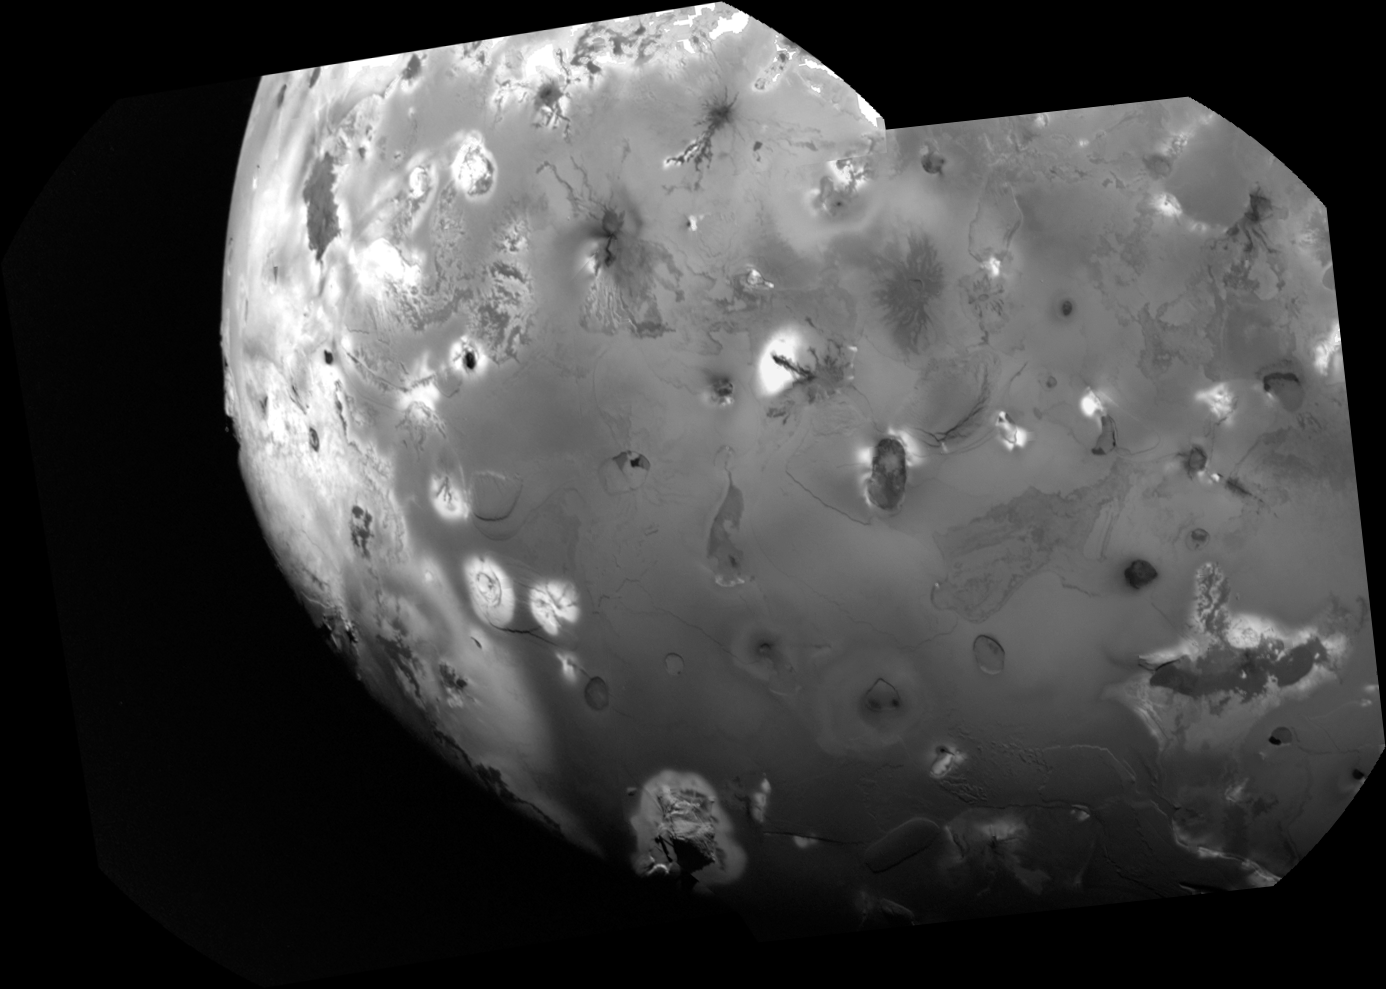
it imaged Io in eclipse on June 29, 1996. These first images were taken in the Solid State Imager's clear filter, just as
Voyager 1's eclipse observation was, but unlike
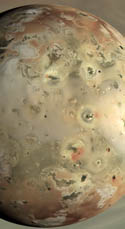
Voyager's camera, the SSI was sensitive to photons from the near-infrared portion of the spectrum (0.7-1.0 microns). This allowed the SSI camera to detect volcanic hot spots with temperatures greater than 700 K. Scientists found several visible hotspots in this first observation (Pele, Reiden, Marduk, Isum, Mulungu, Fo, and Zamama), providing a proof of concept for this method, which supplemented the spectral observations of the Near-Infrared Mapping Spectrometer (NIMS). The greater sensitivity to high-temperature volcanism, and finding it all across Io's surface also provided further proof that basaltic volcanism was wide-spread. In addition to these more discreet glows,
Galileo also observed fainter glows from volcanic plumes (such as Ra Patera), similar to the
Voyager observation. The limb of Io also glowed, not just the poles
Voyager had seen, though the south pole was brighter in this case (the north pole was brighter when Voyager observed Io in eclipse).
Galileo observed Io while the moon was in eclipse during most of its nominal mission orbits and on several occasions during the extended missions. These images allowed scientists to monitor high-temperature volcanic activity on the surface. A particularly
brilliant hot spot was seen at Pillan in June 1997, providing evidence for a massive volcanic eruption there, which would be confirmed by the presence of a volcanic plume in daylight images from that orbit and a massive surface change around the hotspot seen three months later. Eclipse images even showed how Pillan's hot spot had split by September and November 1997 due to lava flowing down into Pillan Patera from the plains above, thus creating a new source of thermal emission in the near-infrared. Such small-scale details were not visible to the NIMS instrument until
Galileo's encounters with Io later in the mission. Images taken in the clear filter as well as SSI's near-infrared filters, such as the one at 1.0 micron, provided a way to crudely measure the blackbody temperature of Io's high-temperature volcanoes. This was accomplished by calculating the ratio between the clear filter radiance of a hot spot and its radiance in the one micron filter.
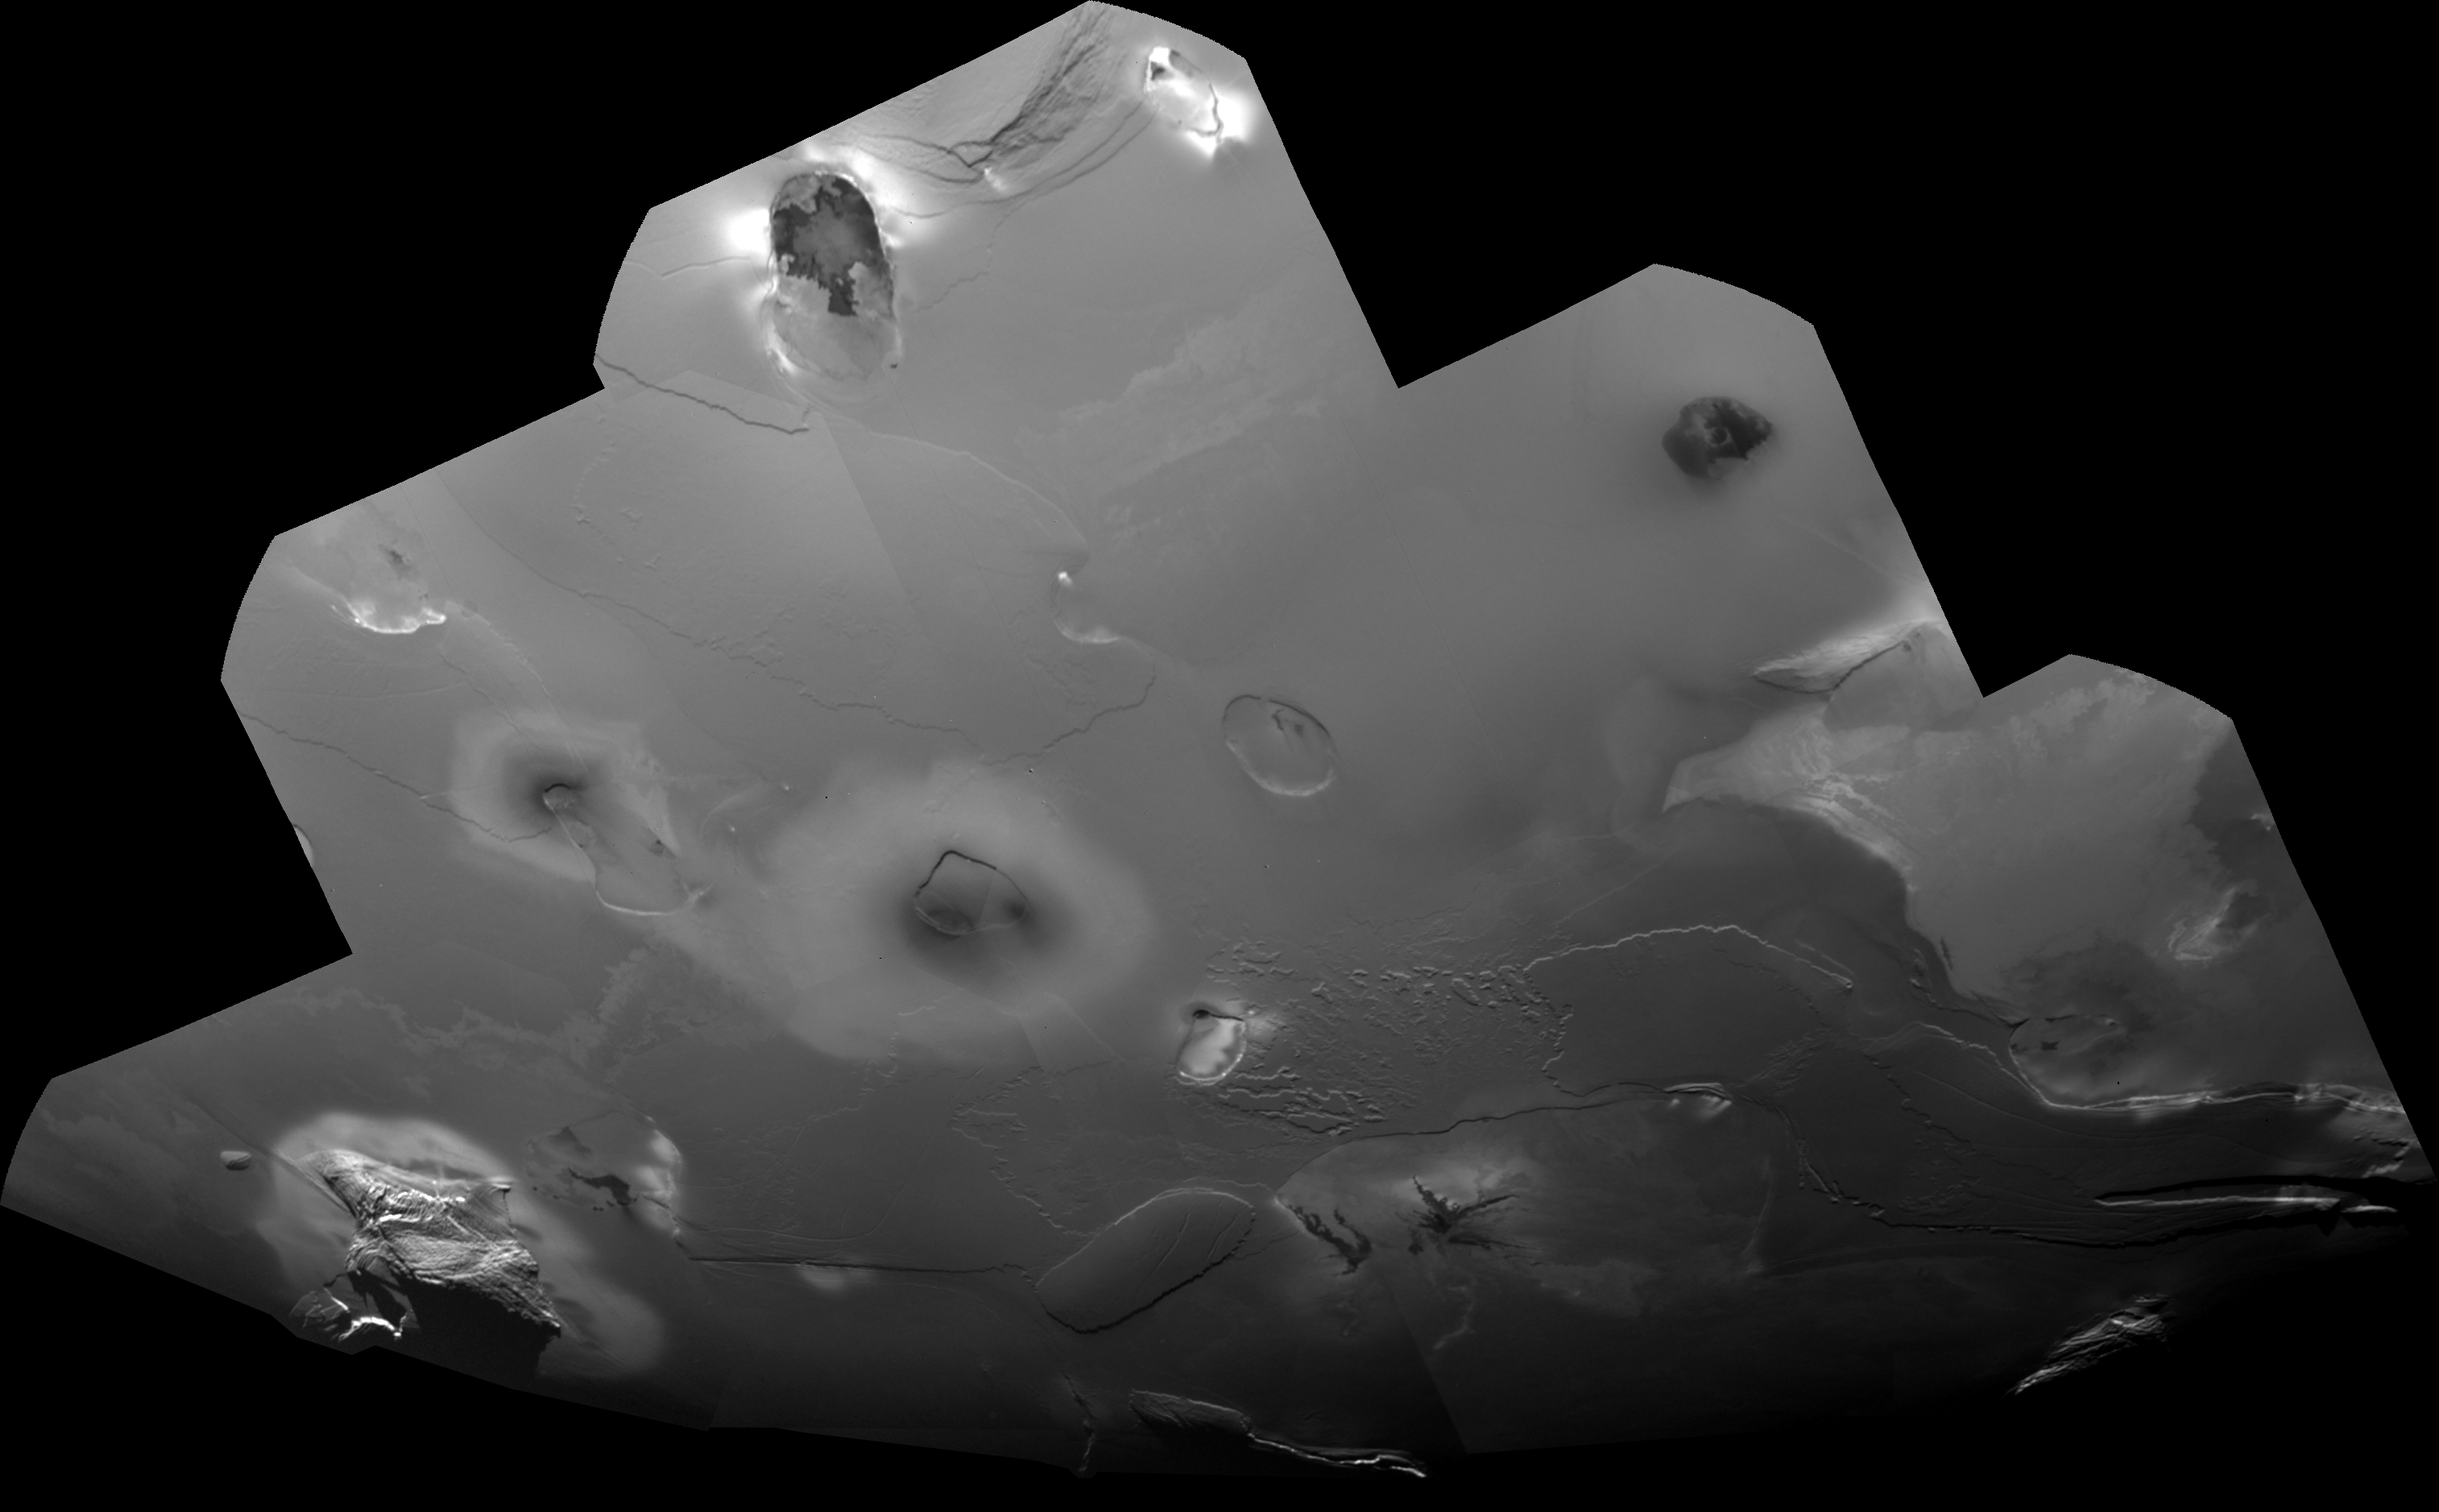
Galileo's observations of Io in eclipse also allowed scientists to better understand the faint glows from the plumes and atmosphere. These glows are the result of interactions between Jupiter's magnetosphere and the atmosphere of Io. On two of Io's orbits, G8 and E15,
Galileo scientists imaged Io in color to better understand the types of emissions that make up the aurorae on Io. The best of this data set, from May 1998, is shown at left. They reveal glowing aurorae of various color across different parts of Io's surface. These can be categorized as bright blue, equatorial glows, red polar limb glows, and fainter green, anti-Jupiter hemisphere glows. When an excited atom or molecule returns to the ground state, it sends out a photon with a specific energy. This energy depends on the type of atom and on the level of excitement, and we perceive the energy of a photon as color as the energy relates to a specific wavelength on the visible spectrum. Just as red aurora on Earth are caused by atomic oxygen, the red limb auroral glows on Io are thought to be due to emission from neutral atomic oxygen at 630 and 636 nm. The oxygen in Io does not derive from organisms on the surface, but from the break-up by solar ultraviolet light of sulfur dioxide in a process called photolysis:
SO2 + hν → SO + O.
The green glows are thought to caused by excitation of neutral atomic sodium, which releases photons in the sodium D lines at 589 and 590 nm, within the bandwidth of the green filter. Atomic sodium is another photolysis product, this time deriving from sodium chloride belched from Io's volcanoes. The bright blue glows along the limb near Io's equator are thought to be due to the excitation of molecular sulfur dioxide. Most of these glows are related to various plumes visible near Io's limb at the time of the observation, including Amirani, Acala, Prometheus, Zamama, and Culann. The identification of these chemical species are supported by ground-based and Hubble observations of Io's aurorae, which revealed the presence and absence of various atomic and molecular emission lines, including sulfur and oxygen lines in the ultraviolet at 190 and 135.6 nm, respectively.
Geissler et al. (2001) explored much of the available
Galileo and
Cassini eclipse image dataset and reported on the how the intensity and position of these auroral emissions change with time. For example, across the
Galileo dataset, the red limb emissions were brightest over either Io's north or south pole. The bright equatorial glows, visible as blue glows in the E15 dataset, tend to be located either at plumes or near the sub- and anti-Jovian points on Io's surface. In the latter case, these glows at various times either appear north of the sub-Jovian point and south of the anti-Jovian point, or vice versa. Both temporal variations in the red limb glows and the blue equatorial glows are related to Io's position in the Jovian magnetosphere. Jupiter's magnetic field is tilted with respect to the orbital plane of its main satellites by 9 degrees, so at various times as Io's orbits the planet, the moon is either above or below the equatorial plane of Jupiter's magnetic field. At a system III longitude (λ
III) of 0°, Io is below the normal plane of the magnetic field (this occurs with λ
III between 290° and 110°). The ion flux from the plasma torus is greatest over the north polar region of Io, causing greater excitation and increasing the brightness of Io's red auroral glows over the north pole. Jupiter's magnetic field lines are also tilted with respect to Io's equatorial plane, so they are tangent to surface north of the equator near Io's sub-Jovian point, and south of the equator near the moon's anti-Jovian point. When the λ
III longitude is between 110° and 290°, Io's situation is reversed as it is now above the plasma torus. This time, the south pole limb emissions are brighter than the north's, and the equatorial glows (that aren't related to volcanic plumes) have switched hemisphere as they are now bright south of the sub-Jovian point and north of the anti-Jovian point. This cycle recurs every 12.95 hours, the
synodic period between Io's orbital period and the rotational period of Jupiter's magnetic field.
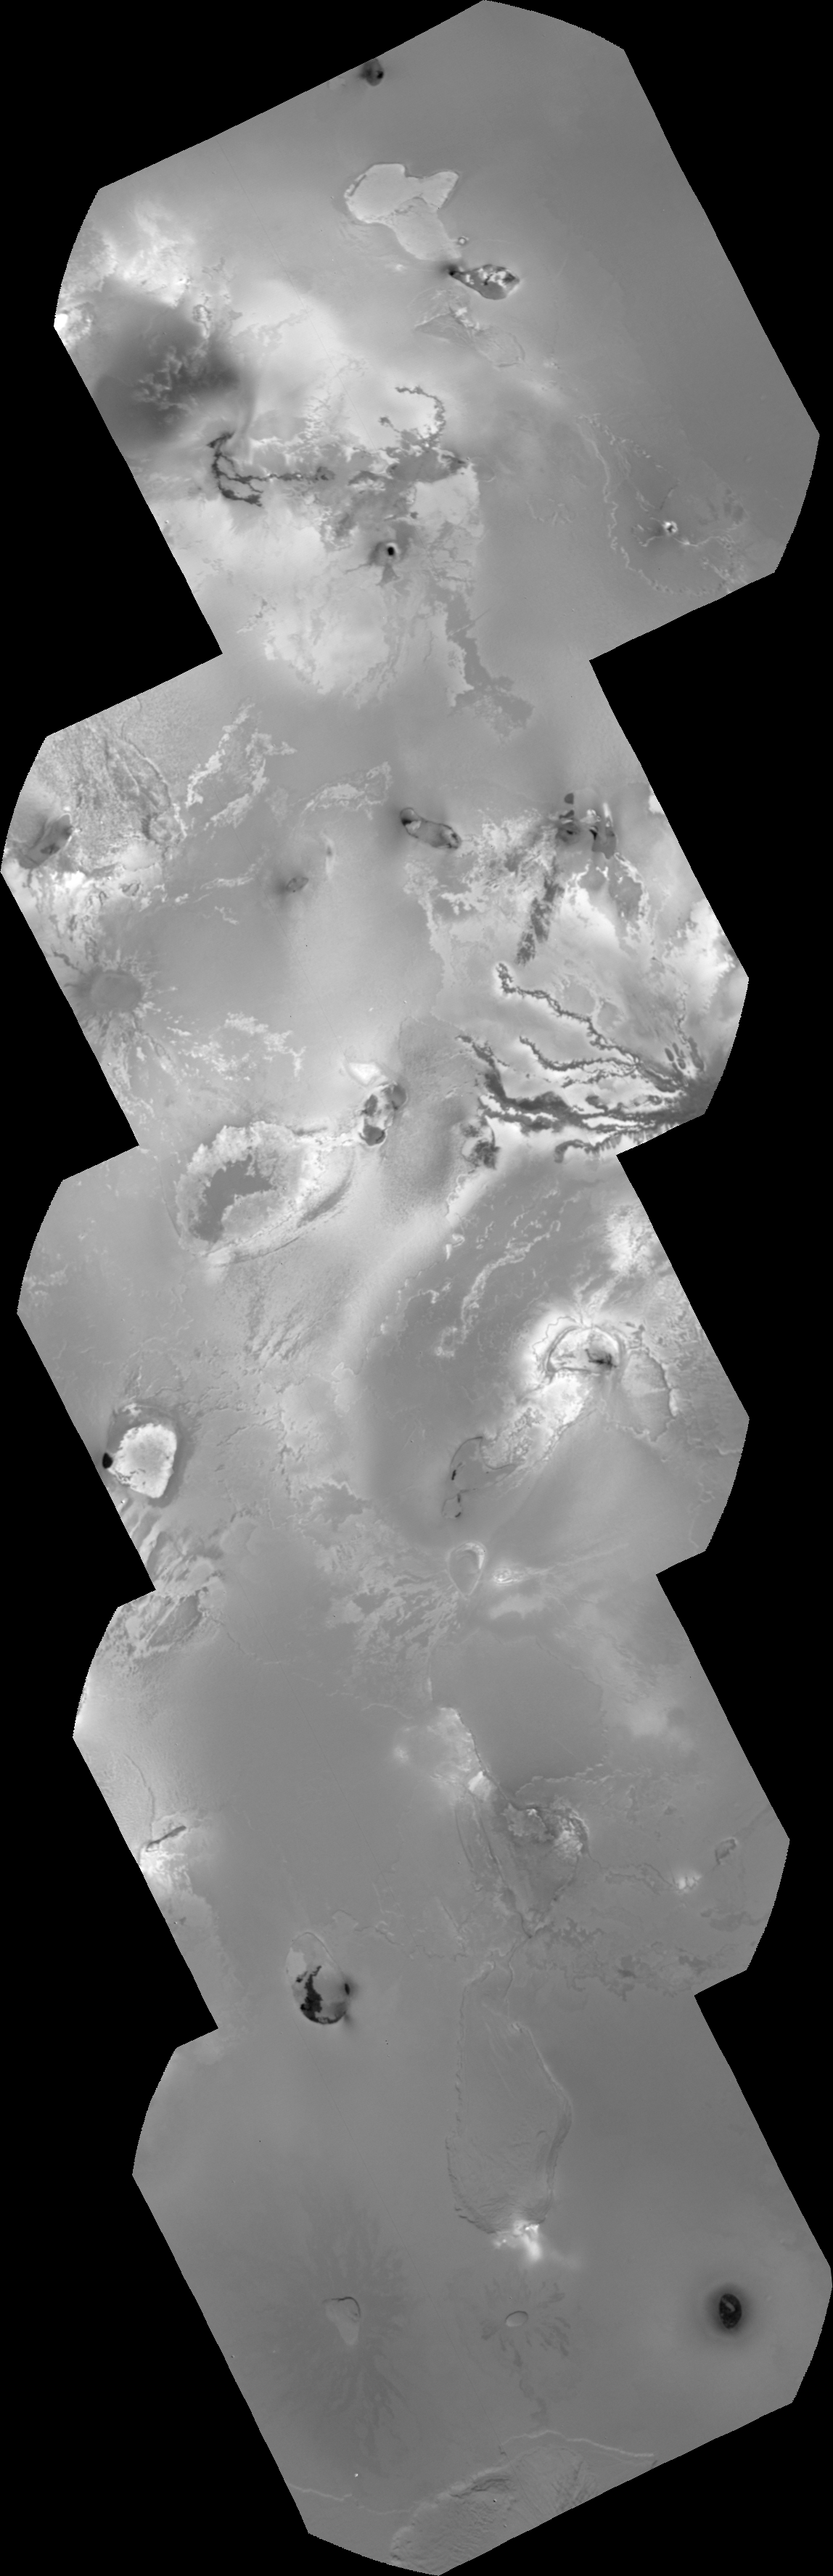
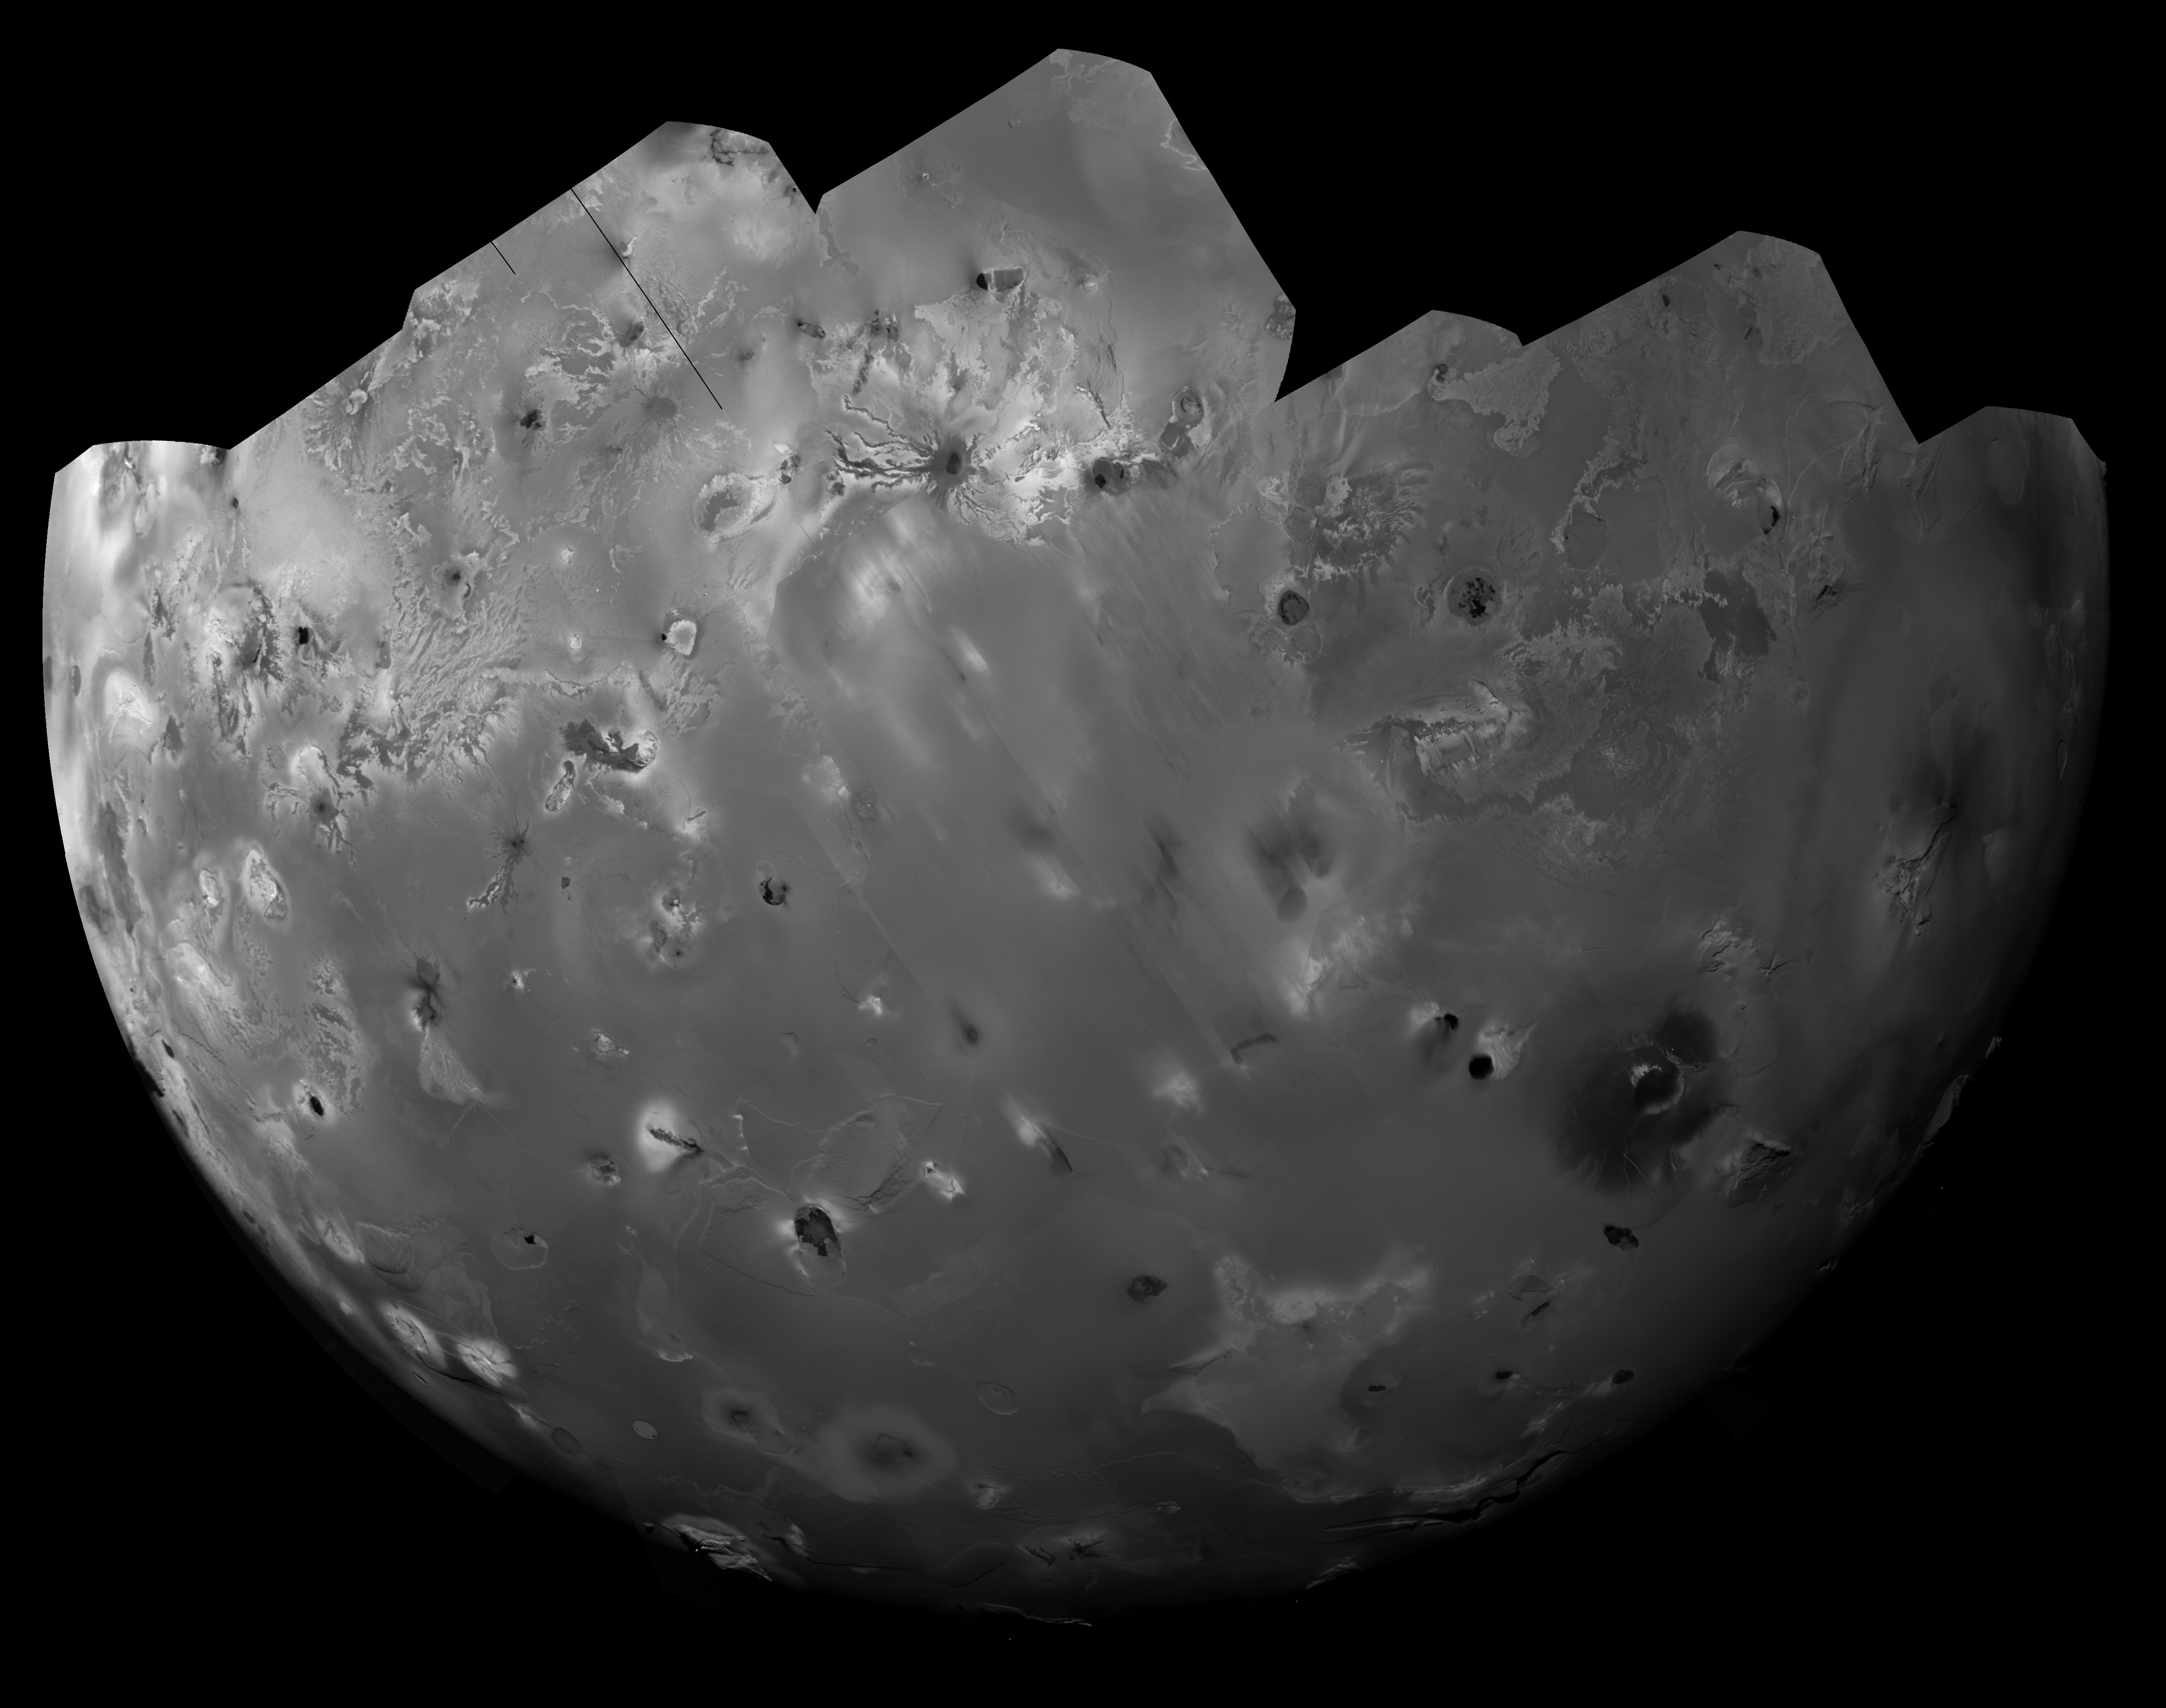
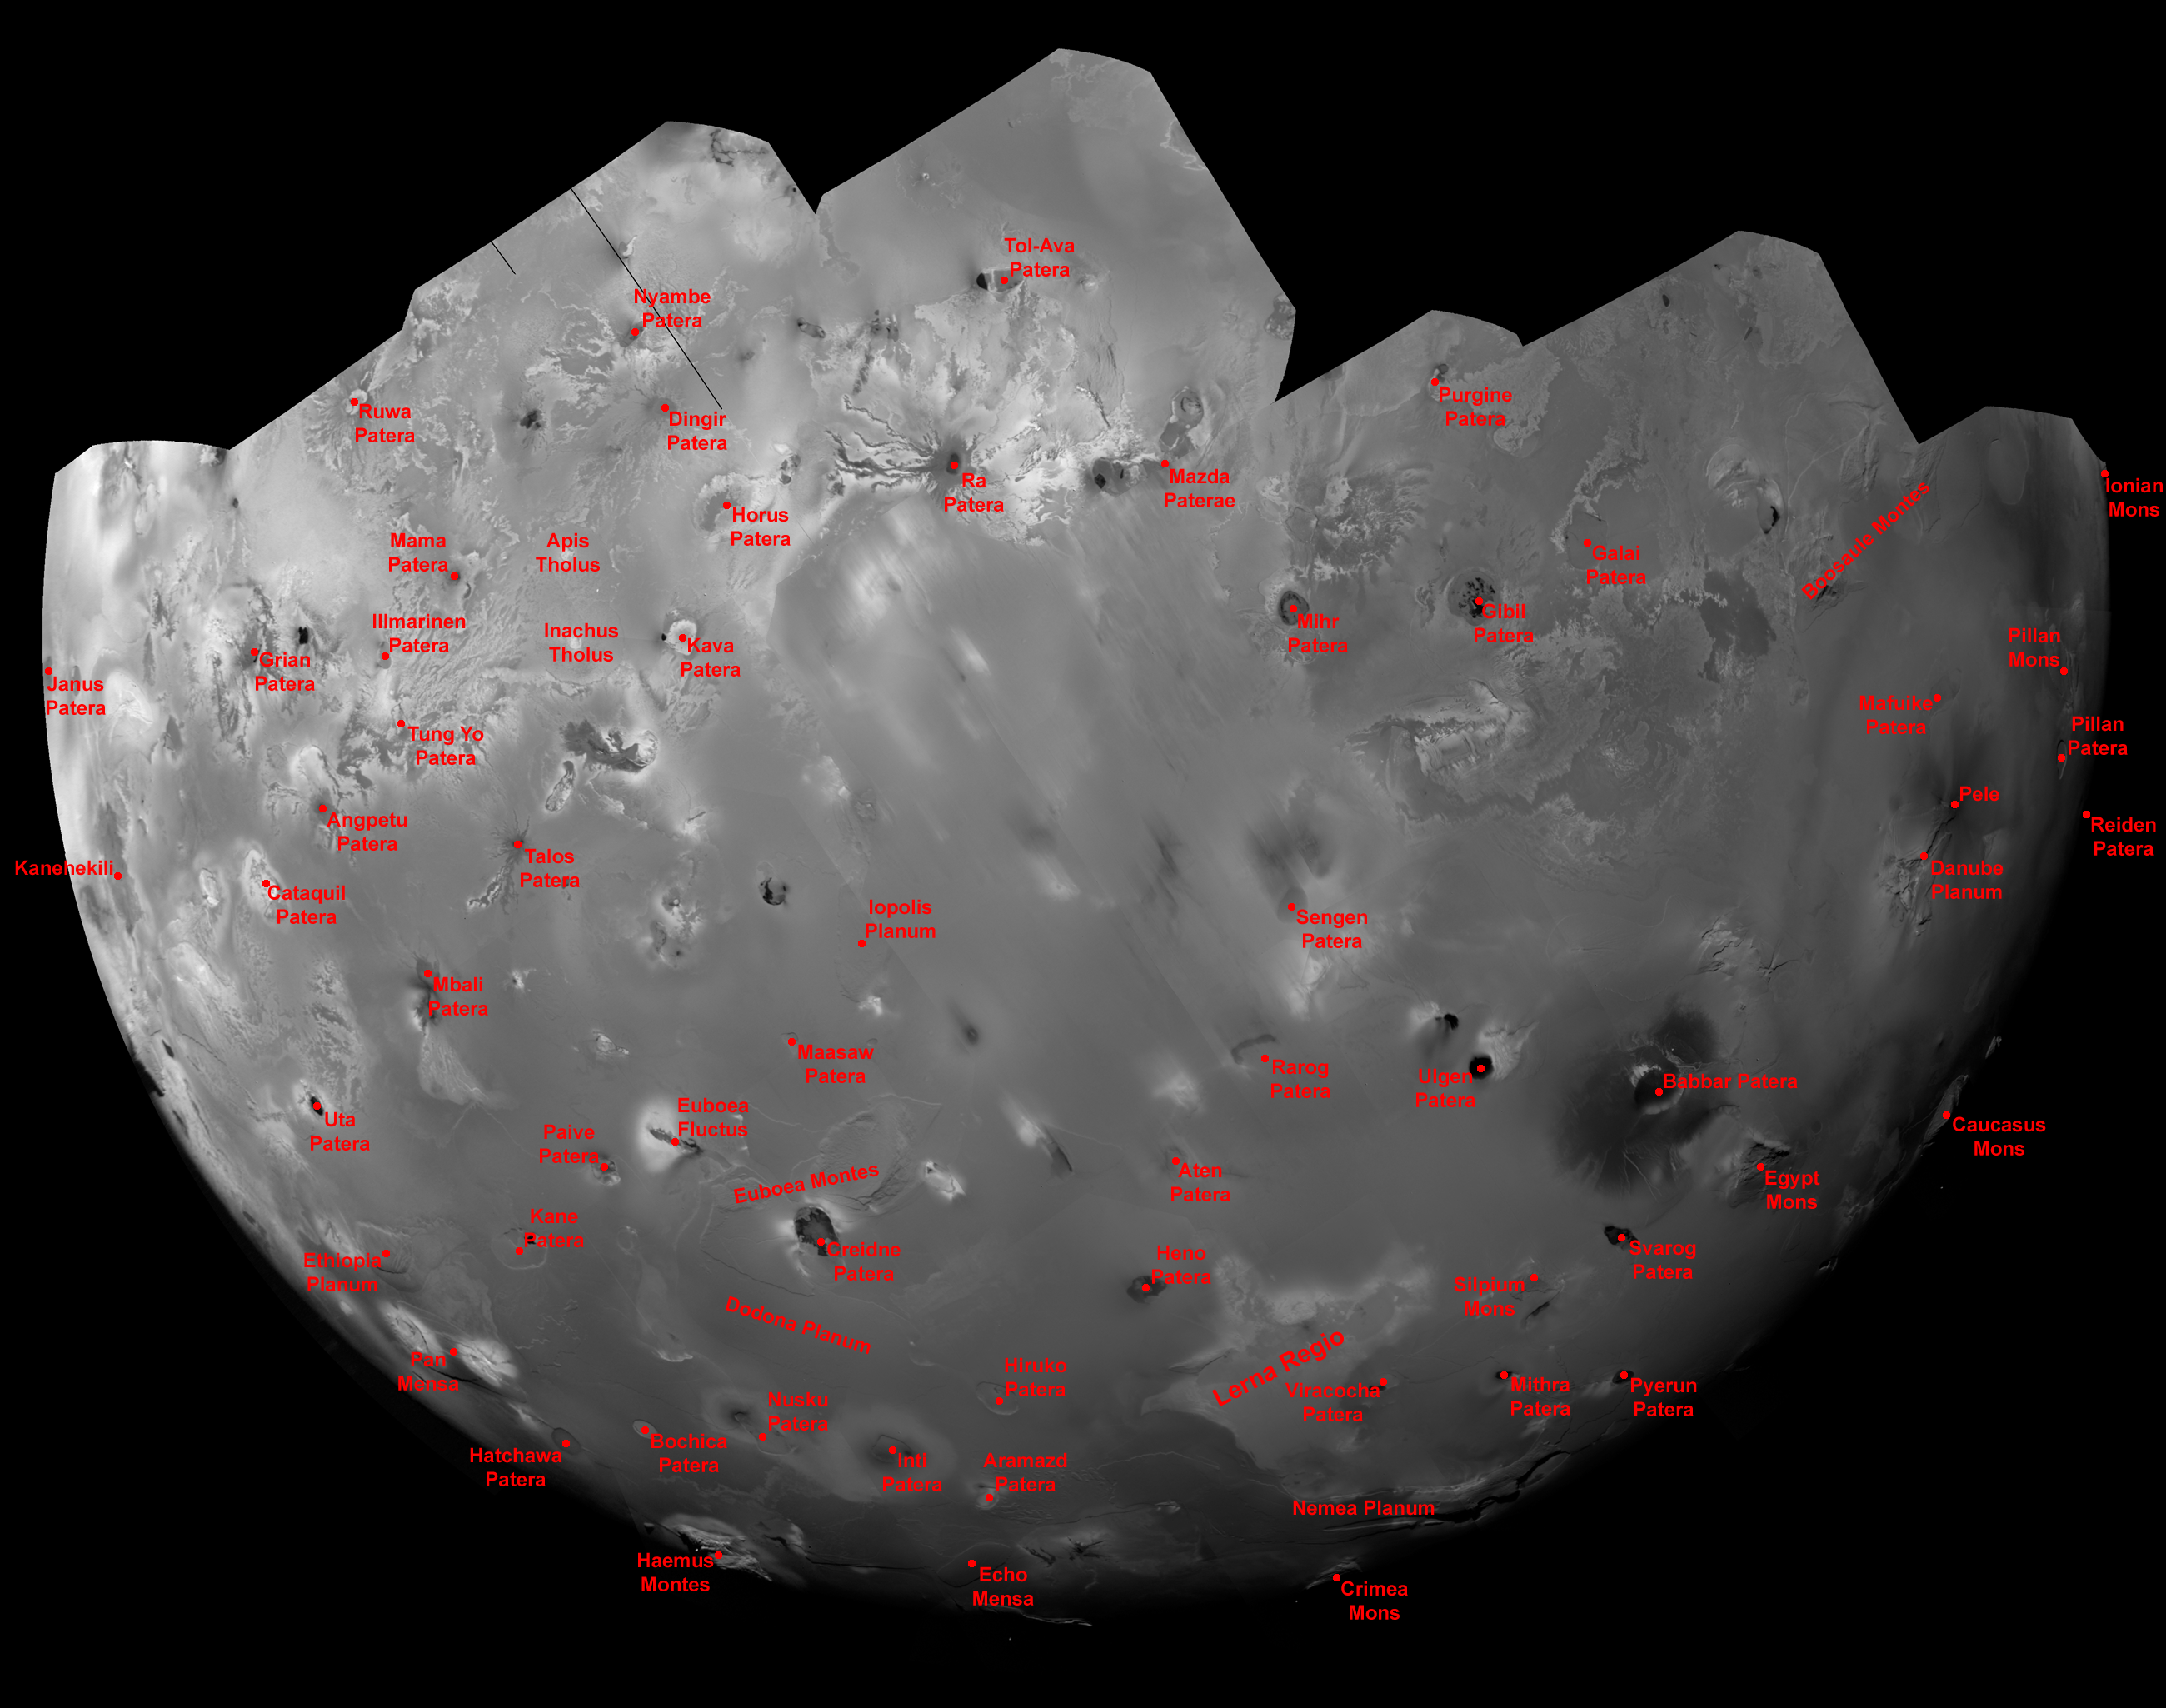
A word should be said about one of the mysteries regarding
Galileo and
New Horizons eclipse observations of Io: scattered around the sub-Jovian and anti-Jovian points on the satellite are a great number of glowing spots. These spots appear similar to hot spots in size and intensity, but their concentration is much greater than the rest of the satellite. Each of these spots can be correlated with a volcanic feature in Voyager images of this region. Other infrared observations of the satellite suggest that thermal emission is not higher in these regions compared to the rest of Io, so the spots are probably not thermal emission from high-temperature lava. As you can see in the image at left, the glows seem to be concentrated north of the equator near the sub-Jovian point (the white lines in the image are the equator [horizontal line] and the prime meridian [curved vertical line]), consistent with the tangent point of the Jovian magnetic field lines at the time of this observation. From this one could surmise that these spots are the result of glowing gases rather than thermal emission. But what would concentrate these gases into discreet spots that "look" like hot spots? One theory that I favor suggests that these spots are related to gases being slowly leaked from Io's interior at cooler volcanoes. Not enough gas is released at these volcanoes to form plumes, but there is enough of sulfur dioxide that their auroral emissions are brighter than the surrounding regions. They show up near the sub- and anti-Jovian points and not in other regions, not because there are more volcanoes there, but because Jupiter's magnetic field lines, and the electrons that are transported along them, connect to Io in these two regions. This increased electron flux increases the brightness of the auroral emissions.
Future missions to Io will certainly use this technique to monitor changes in Io's volcanic activity and atmospheric emissions. Narrow-band filters on future cameras would allow researchers to focus on specific line emissions from various chemical species such as atomic oxygen, sulfur, and sodium. They would also allow for improved measurements of hot spot temperatures. With increased bandwidth, more images using different filters can be taken during each eclipse, allowing for temporal variability of auroral and volcanic thermal emission to be monitored. Finally, these measurements will allow researchers to determine the contribution outgassing from smaller volcanoes provides to Io's atmosphere. Previously modeling focused on the contribution a few volcanic plumes provide, but not weaker outgassing from cooler, but more numerous, volcanoes.
References:
Cook, A. F.;
et al. (1981). "
Volcanic Origin of the Eruptive Plumes on Io".
Science 211 (4489): 1,419–1,422.
McEwen, A. S.;
et al. (1997). "
High-temperature hot spots on Io as seen by the Galileo solid state imaging (SSI) experiment".
Geophysical Research Letters 24 (20): 2443–2446.
McEwen, A. S.;
et al. (1998). "
High-Temperature Silicate Volcanism on Jupiter's Moon Io".
Science 280 (5373): 87–90.
Geissler, P.;
et al. (1999). "
Galileo Imaging of Atmospheric Emissions from Io".
Science 285 (5429): 870–874.
Geissler, P.;
et al. (2001). "
Morphology and time variability of Io's visible aurora".
Journal of Geophysical Research 106 (A11): 26,137–26,146.


