
 I have started creating a series of maps to be posted on my Io Images Page for each Galileo orbit. These maps can be used to look at changes that occurred on Io during that mission. Each map is in simple cylindrical projection centered at 180 deg. West longitude.
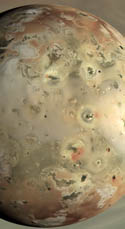
The first map I've created is for C9 and contains images acquired by Galileo's SSI camera in mid-September 1997. The map contains three images that cover Io's leading and anti-Jupiter hemispheres. While I used photometric correction procedures to flatten the images (reducing the effects of lighting angles), brightness differences are apparent between images due to the odd photometric properties of Io's surface, particularly areas coated with coarse grained sulfur dioxide frost or ice (see my post from last week detailing research into the distribution of this frost on Io's surface).
Because this work requires a bit more attention then some of the reprocessing work I did last spring, don't expect this stuff to be posted quickly, maybe 1 or 2 maps per week, though this week I may get out a few more since I will focus on orbits with three or fewer images to use. At the end of this project, I may tie up these maps into some kind of product, maybe an animated gif and a photoshop project.
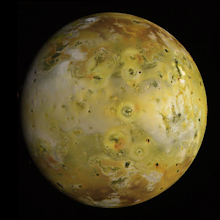
Quick note: I've gone ahead and added the G2 map. This was nice and quick since there was only one color observation that orbit. This map has a resolution of 4.9 km/pixel. In fact, most of these maps will have a resolution to match the top resolution to match the best resolution for that orbit (with a max of 1 km/pixel). I also want to point out that I am trimming each observation so that the max emission angle (angle from nadir) is 75 degrees and the max incidence angle (solar angle; 0 degrees is the sub-solar point; 90 degrees is at the terminator) is 80 degrees. So coverage at the poles for these maps will be quite limited.
Link: C9 Galileo Images [pirlwww.lpl.arizona.edu]


No comments:
Post a Comment