Showing posts with label Icarus. Show all posts

Friday, June 4, 2010

Paper: Ground-based observations of the variability of Io's volcanoes

Today, a new paper was published "in press" (accepted and revised, but not yet in a paper issue) in the journal Icarus titled, "Ground-based observations of time-variability in multiple active volcanoes on Io" by Julie Rathbun and John Spencer.  In this paper, the two authors summarize the results they obtained by observing Io using NASA's Infrared Telescope Facility on more than 100 occasions between June 1997 and the end of 2005.  They focus on variations in the thermal output of three volcanoes: Loki, Kanehekili, and Janus, as well as output from smaller volcanic centers like Grian Patera.

For their analysis, Rathbun and Spencer observed Io in the near-infrared at 2.26, 3.5, and 4.68 microns both in disk-resolved images while Io was in Jupiter's shadow and in sunlight.  An example of an image taken while Io was in sunlight is shown at left.  It was taken in November 1999 when the volcano Tvashtar Paterae erupted (seen much closer up by Galileo).  In both cases (in eclipse and in sunlight), the spatial resolution of the observation is generally too low to pick up any but the brightest hotspots.  The authors also measured the brightness at 3.5 microns of an eclipsed Io as it passed behind the dark limb of Jupiter.  By noting the times when dips in the occultation light curve occurred, caused by Jupiter occulting a volcanic hotspot, the authors were able to constrain the location and intensity of an erupting volcano.  Unfortunately, these would be one-dimensional fits of Jupiter's limb projected on the surface of Io.  This method is also limited to finding hotspots on Io's Jupiter-facing hemisphere.

Three of the most persistent hotspots on the sub-Jupiter hemisphere are Loki, Kanehekili, and Janus.  Rathbun and Spencer used their eight-year span of ground-based observations to chart variations in the amount of energy (in terms of Gigawatts) output by these volcanoes.  Loki, Io's most powerful volcano, experienced periodic increases in power output between 1990 and 2001.  In 2002, Rathbun and her colleagues suggested that this periodicity was due to a crust over a large lava lake foundering after becoming too thick, starting a wave of overturning crust that spreads counter-clockwise around the patera starting from the southwest corner of the volcano.  However, the authors note in this paper that this pattern ended after 2001 (around the time Rathbun published her paper describing the periodicity) as Loki's power output leveled out in 2001-2002 a bit below the average between the earlier active and inactive episodes, before weakening between 2005 and 2007.  Their extended history of Loki observations suggests that there have been no brightening events since 2001.  The authors concluded that the measured brightness of Loki at 3.5 microns, and the derived brightness at 2.26 and 4.68 microns (taken by subtracting the total power output of Io in eclipse when Loki is shown by the occultation data to be inactive from the power output of Io when Loki is active) is consistent with the author's thermal model of Loki.

Kanehekili and Janus are two volcanoes on Io's leading hemisphere located within Media Regio.  Ground-based observations by Rathbun and Spencer were unable to distinguish activity between these volcanoes are their proximity and Galileo observations of both of them as persistently-active volcanoes. The authors found that the 3.5 micron brightness of the region containing Janus and Kanehekili remained fairly consistent between 1996 and 1998 at a level similar to that of Loki in 2003 and 2004, before trending downward.  A significant increase was observed early in 2002, though the authors couldn't distinguish between an increase in activity at either volcano, or another volcano at that longitude.  I will point out that Marchis et al. 2005 observed a fairly bright hotspot at Janus in December 2001 using the Keck telescope, a few months prior to the Rathtbun and Spencer observations, and a very powerful eruption at Janus in January 2003.  Combined with the observations of variations in the brightness of Janus and Kanehekili at shorter wavelengths by Galileo SSI and NIMS noted by Rathbun and Spencer, this indicates that the high-temperature component of the eruptions at these two volcanoes can vary greatly, even if the lower-temperature one stays comparatively consistent.

Finally, the authors examined shorter-lived volcanic eruptions from other sources they found in their data.  These sources show significant variations in 3.5 micron brightness from near the background brightness to some of the brightest events seen in their decade of observing, such as an eruption of Grian Patera in June 1999.  The observed variations are consistent with non-persistent volcanic activity creating fresh, cooling lava that emits light in the near-infrared.  The authors noted weaker variations were observed in the mid-infrared by the PPR instrument on Galileo, which was sensitive to cooler, older lava flows.

Link: Ground-based observations of time-variability in multiple active volcanoes on Io [dx.doi.org]

Saturday, March 6, 2010

Paper: Mapping Io's Atmosphere with the Submillimeter Array

Another day, another Io atmosphere paper.  Today, we take a look at a paper by Arielle Moullet, Mark A. Gurwell, Emmanuel Lellouch, and Raphaël Moreno titled, "Simultaneous mapping of SO2, SO, NaCl in Io’s atmosphere with the Submillimeter Array." This paper was posted online Thursday in the Papers in Press section of the journal Icarus.  In press papers are articles which have gone through peer review, were revised, and have been approved for publication, but have not been published in the print journal yet.  This paper discusses results from sub-millimeter wavelength observations of Io's leading and trailing hemisphere.  Using these observations, the authors were able to map the distribution of three chemical species in Io's atmosphere, sulfur dioxide (SO2), sulfur monoxide (SO), and sodium chloride (NaCl).  The authors then used these maps and the intensity of the observed emission lines to model the sources for these atmospheric components.  For additional information beyond this summary, check out Moullet's presentation from the Harvard-Smithsonian Center for Astrophysics SMA Science Symposium 2009.

Io has a very thin atmosphere (1-10 nanobars at the surface) composed mostly of sulfur dioxide, along with its disassociation products, sulfur monoxide and atomic sulfur and oxygen.  Other gases observed in Io's atmosphere or thought to exist in Io's atmosphere include sodium chloride, potassium chloride (KCl), diatomic sulfur (S2), and sulfuryl chloride (Cl2SO2).  Io's atmosphere has significant density variations with time of day, being densest near the sub-solar point and thinnest on its night side, and with position on the surface.  The distribution of SO2 gas was mapped across Io's surface using Hubble ultraviolet images of Io at the hydrogen Lyman-α line by Feaga et al. 2009, finding Io's sulfur dioxide gas in the atmosphere to be densest within 40 degrees of latitude from the equator and on Io's anti-Jupiter hemisphere.  Adaptive optics observations at Keck in 2002 showed SO gas at several volcanic centers, which de Pater et al. 2007 suggested was related to volcanic activity.  One of major questions these observations are trying to answer include identifying the dominant source of Io's atmosphere, whether it is sublimation of surface frosts, as atmospheric sulfur dioxide is thought to be in vapor-pressure equilibrium with the surface, or direct volcanic outgassing.

In this new paper, Moullet et al. 2010, the authors used observations taken at the Submillimeter Array (SMA) atop Mauna Kea in Hawaii, a set of eight, 6-meter-wide radio antennas acting as a radio interferometer.  The system observes at millimeter and sub-millimeter wavelengths between 0.3 and 1.7 millimeters (or frequencies between 180 and 700 GHz), at between the infrared and microwave portions of the electromagnetic spectrum.  For these observations, Moullet et al. observed Io in June 2006 and July 2008 at 338 and 346 GHz, at emission bands for sulfur dioxide, sulfur monoxide, and sodium chloride.  These observations were disk-resolved, allowing the authors to examine the hemispherical distribution of each gas species, and in the case of SO2 and SO, the high spectral resolution and signal-to-noise ratio allowed for more detailed analysis of their total emission.

For SO2, Moullet et al.'s SMA data at 346.523 and 346.652 GHz is consistent with the results from Fegea et al.'s Lyman-α data and Spencer et al. 2005's infrared data, further indicating that the sulfur dioxide in Io's atmosphere is predominantly located at equatorial latitudes and Io's anti-Jovian hemisphere.  Both constraints on the distribution of SO2 are similar to the distribution of sulfur dioxide frost on Io's surface and volcanic plumes.  To see which source of SO2 dominates, volcanic outgassing or sublimation of surface frosts, the authors modeled the appearance of Io's 346.652 GHz SO2 line emission using a hydrostatic model of Io's sublimation atmosphere and another modeling emission purely from the volcanic plumes noted by Geissler et al. 2004.  Using an appropriate number of active plumes, the authors found that volcanism does not match the distribution and shape of SO2 gas seen in the SMA data (except for the slight northward offset in emission seen over the anti-Jovian hemisphere in 2006).  In addition, to match the amount of emission observed, an unrealistic number of active volcanic plumes (40-230 Prometheus-type, or 5-20 Pele-type plumes, on each hemisphere) would be required.  Even if all 16 plumes noted by Geissler et al. were active, they would still only account for 5-11% of the emission on the leading side, and 13-18% on the trailing side.  The hydrostatic models of the frost sublimation component of Io's SO2 atmosphere better match the distribution and emission flux seen in the SMA data. The derived SO2 column densities (an average of 2.3-4.6×1016 cm−2 for the leading hemisphere, and 0.7-1.1×1016 cm−2 for the trailing side), gas temperatures, and variations with Io's distance from the Sun provide further evidence that the main source for sulfur dioxide, the dominant component in the satellite's atmosphere, is vapor-pressure equilibrium sublimation of SO2 surface frosts.  A minor fraction of the SO2 also comes from volcanic gas plumes (though not all gas emissions for volcanoes form plumes).

Moullet et al. also mapped the distribution of sulfur monoxide and sodium chloride in Io's atmosphere for the first time.  Both gases were predominately found on Io's anti-Jupiter hemisphere, as SO2 was.  The signal-to-noise ratio for the SO data was sufficient for the authors to perform an analysis on the source of that gas, similar to the one they performed on sulfur dioxide. Two sources were considered: photolysis of SO2, when sulfur dioxide is broken up by solar ultraviolet photons into SO and O, and direct volcanic emission.  In the case of volcanic activity, they found that, using a reasonable level of plume activity, volcanism is the source of 2.5% of the SO observed in the SMA data, using a model that included four volcanic plumes.  Using more plumes, or Pele plumes, would result in models that was more extended spatially than the emission maps from the data acquired.  Even using a favorable, 16 plume model, volcanic plumes account for 13-40% of the total SO emission, assuming a 10% mixing fraction in the plumes.  This at least suggests though, that volcanism is a more significant source of sulfur monoxide than sulfur dioxide.  The dominant source, however, is photolysis from SO2, as the modeling performed by Moullet et al. suggests.  The authors note that the "relative contribution is not easy to assess in the absence of precise estimates on SO lifetime in the atmosphere."

The signal-to-noise ratios of the NaCl maps were much lower than those for the SO2 and SO data, but radiative transfer modeling of NaCl in Io's atmosphere shows that the data is consistent with a volcanic origin. This is particularly the case since NaCl has a short lifetime in Io's atmosphere due loss from condensation on dust particles and photolysis into atomic sodium and chloride.  The amount of NaCl emission observed is consistent with a lower-bound, mixing ratio in volcanic plumes of 0.6% on the trailing hemisphere, and 2.5% on the leading side, similar to thermochemical modeling done by Fegley and Zolotov 2000.  Moullet et al. could not rule out other sources for the NaCl emission, such as sputtering.

This paper seems to provide further evidence that most of the gases in Io's atmosphere result from the sublimation of sulfur dioxide surface frosts, with direct volcanic emission playing a minor role.  Other major atmospheric components such as sulfur, oxygen, and sulfur monoxide result from the photo-disassocation of sulfur dioxide into its elemental components by solar ultraviolet photons, though a larger percentage of the sulfur monoxide in the atmosphere may come from direct volcanic outgassing.  Finally, some atmospheric components not related to sulfur chemistry, such as sodium chloride, could be entirely explained by volcanic outgassing, though other sources such as sputtering are also possible, but weren't modeled by the authors as the distribution of surface deposits of minerals other than sulfur and sulfur dioxide are very poorly constrained.  According to their presentation from April 2009, the authors stated they planned to map the distribution of other species such as potassium chloride, silicon oxide, and disulfur monoxide in the summer of 2009 using the APEX antenna in Chile, and will submit a proposal to observe Io's atmosphere at much higher resolution using the ALMA telescopes when they are finished in 2012.

Link: Simultaneous mapping of SO2, SO, NaCl in Io’s atmosphere with the Submillimeter Array [dx.doi.org]
Link: Presentation - Mapping of SO2, SO and NaCl emission in Io's atmosphere [www.cfa.harvard.edu]

Monday, January 25, 2010

Carnival of Space #138 and other news

The 138th edition of the Carnival of Space, a weekly series highlighting the best in the astronomy and space blogosphere, is now online at Nancy Atkinson's new blog.  You know the drill.  Some great posts the Mars rover Opportunity's latest travels, Martian dunes as imaged by HiRISE, and the Southern Cross from various exoplanets.

I also wanted to take this quick post opportunity to point a few other news items.  There was a paper in Nature Geosciences titled, "Origin of the Ganymede–Callisto dichotomy by impacts during the late heavy bombardment," by Amy Barr and Robin Canup.  I haven't downloaded this paper, but a great summary can be found at ScienceBlog.  Essentially, they found that Ganymede's closer distance to Jupiter and thus being deeper in Jupiter's gravity well, led to more and larger cometary impacts than on Callisto early on in the history of the Solar System.  These impacts helped to cause more complete differentiation on Ganymede by bring rock closer to the core and water closer to the surface.  Fewer large impacts on Callisto meant that it was less differentiated.  Today, Callisto has a more ancient surface with few signs of internal activity, while Ganymede has a convecting iron core producing an internal magnetic field and a surface covered in lanes of grooved terrain separating more ancient terrain.

Finally, there are a couple of new Io-related papers in press in the journal Icarus.  The first is "A Comprehensive Numerical Simulation of Io’s Sublimation-Driven Atmosphere" by Andrew Walker et al.  This paper details a new Monte Carlo simulation of the atmosphere of Io.  The other is "Monte Carlo Modeling of Io’s [OI] 6300 Å and [SII] 6716 Å Auroral Emission in Eclipse" by Chris Moore et al.  This paper will also look at modeling of Io's atmosphere.  In this case, the authors are attempting to recreate observations of Io's aurorae, seen in eclipse in May 1997.  Both these papers have associated LPSC abstracts so I will combine the discussion of them into one post in the next week.

Link: Carnival of Space #137 [noisyastronomer.com]
Link: SwRI researchers offer explanation for the differences between Ganymede and Callisto [www.scienceblog.com]

Wednesday, January 13, 2010

Paper: Verifying a new model of Io's atmosphere by simulating multi-spectral observations

In November, the paper "Multi-wavelength simulations of atmospheric radiation from Io with a 3-D spherical-shell backward Monte Carlo radiative transfer model" was published in press in the journal Icarus.  The authors for this paper are Sergey Gratiy, Andrew Walker, Deborah Levin, David Goldstein, Philip Varghese, Laurence Trafton, and Chris Moore.  This paper takes a look at a computer model of Io's atmosphere, consisting of a composite of sublimation and volcanic sources and published in Walker et al. (submitted to Icarus but not yet available online), and attempts to validate the model by comparing simulated observation derived from the model to real observations published over the last decade.  I have to admit that this paper covers a topic that is definitely out of my wheelhouse, so I may not cover the findings of this paper with as much depth as I have given to other papers recently, but I will do the best I can to provide a summary.

While I have not read the Walker et al. paper covering the details of this new model since it hasn't been accepted by Icarus and posted online, according to this paper, it is a 3-D global rarefied gas dynamics model that uses both volcanic plumes and sublimation of surface sulfur dioxide (SO2) frost as sources for the gas in Io's atmosphere.  The model takes into account changes to the column density of the atmosphere as a result to time-of-day changes to the surface temperature, distribution of SO2 surface frost, distribution of volcanic plumes (though they use persistent volcanic thermal hotspots as plume sites rather than confirmed plume locations or the locations of large surface changes), plasma heating from Jupiter's magnetosphere, and heat loss to space.  For this paper, the authors used a backward monte carlo method to simulate how their model atmosphere would appear in different types of observations.

In Gratiy et al. 2009, the authors compared their model results to three observations: disk-integrated, high-spectral resolution measurements in the mid-infrared near 19-µm published by Spencer et al. 2005; disk-resolved, far-ultraviolet observations in the hydrogen Lyman-α band published in Feldman et al. 2000; and disk-integrated, millimeter wavelength observations published in Io After Galileo in the Io's Atmosphere chapter by Lellouch et al.

First, the authors compared their model output to observations published in Spencer et al. 2005.  For that paper, Spencer observed 16 SO2 ν2 vibrational band absorption lines using the TEXES mid-infrared spectrometer at the NASA Infrared Telescope Facility.  This was disk-integrated spectra centered around 19 microns.  From this data, the authors found a significant longitudinal asymmetry in absorption band depth, a measure of the average column density over the hemisphere sampled, with a low band depth (1%) compared to the continuum level at 315°W (the hemisphere centered near Ra and Loki) and a much stronger bands (7%) at 180°W (the hemisphere centered near Colchis Regio).  This indicates that Io's atmosphere is denser over the anti-Jupiter hemisphere than over the hemisphere centered on Ra and Loki.  This distribution correlates to the distribution of surface frost, but it also correlates with the distribution of volcanic plumes, as Gratiy et al. notes.  The authors of this new paper found that a combined model with sublimation and volcanic sources with long residence times (5000 seconds) for condensed SO2 on bare rock.  They also note that their model and the data from Spencer et al. seem to support a thermal lag where the surface temperature and thus frost sublimation peaks 3.5 hours, or 30° of rotation, after local noon.  This is akin to the terrestrial experience of the air temperature being warmer in the mid- to late-afternoon, as opposed to right at noon when the sun is at its highest point in the sky.  However, if you look at the PPR day-side data from I31, shown at right from Rathbun et al. 2004, there maybe some question of whether that thermal lag is real.

The next dataset the authors compared their model to was the Lyman-α data disk-resolved observations published in Feldman et al. 2000 and Feaga et al. 2009 (the latter paper was discussed here last year).  This data was acquired using the Space Telescope Imaging Spectrograph (STIS) on Hubble between 1997 and 2001.At these far ultraviolet wavelengths, areas where Io's atmosphere are denser absorb sunlight, appear dark in Lyman-α images.  Sunlight is better able to reach the surface and reflect back into space in order to be seen by Hubble.  Thus, areas where Io's atmosphere is thinner appear brighter in Lyman-α images.  An example of one of these images is shown at top.  Gratiy et al. could not reproduce this data with their model, suggesting that they do not properly simulate the latitudinal variation in the column density of Io's atmosphere (thicker at the equator, thinner at the mid-latitudes and poles).  In particular, they had difficulty reconciling the observed sharp increase in Lyman-α brightness, and therefore the sharp decrease in atmospheric column density, 45° North or South of the equator, and with the utter lack of atmosphere beyond 60° North or South latitude.  This cutoff, the authors suggest, is more consistent with the distribution of surface changes and volcanic hotspots, as opposed to surface frost.  However, there don't seem to be variations in the Lyman-α images resulting from known volcanic plumes.  The lack of an east-west asymmetry on either side of the central meridian in Io's equatorial brightness in the far-ultraviolet data that would be expected from the Walker et al. model suggests that the surface thermal inertia is much lower than they used for that model.

In the final comparison, Gratiy et al. compared their model to disk-integrated millimeter-wave SO2 emission line profiles obtained at IRAM 30-meter telescope in Spain, published in Io After Galileo in the Io's Atmosphere chapter by Lellouch et al. and disk-resolved data in Moullet et al. 2008.  The authors determined that strong atmospheric winds explain the wider SO2 emission lines in the IRAM data compared to what would be expected from thermal Doppler effects alone.

To be honest, this was a difficult paper for me to get through, hence why it took a month and a half for me to get this summary up.  So, I apologize for not explaining the paper's conclusions as well as I could have.  Basically, the authors hope that by comparing their rarefied gas dynamics model of Io's atmosphere with real observations they can make some improvements to that model that also provide new information about Io, such as the presence and strength of atmospheric winds, the surface thermal inertia, and the relative contribution of frost sublimation and volcanic plumes to Io's atmosphere.

Link: Multi-wavelength simulations of atmospheric radiation from Io with a 3-D spherical-shell backward Monte Carlo radiative transfer model [dx.doi.org]

Monday, December 14, 2009

Paper: Geomorphologic Mapping of Hi'iaka and Shamshu Regions

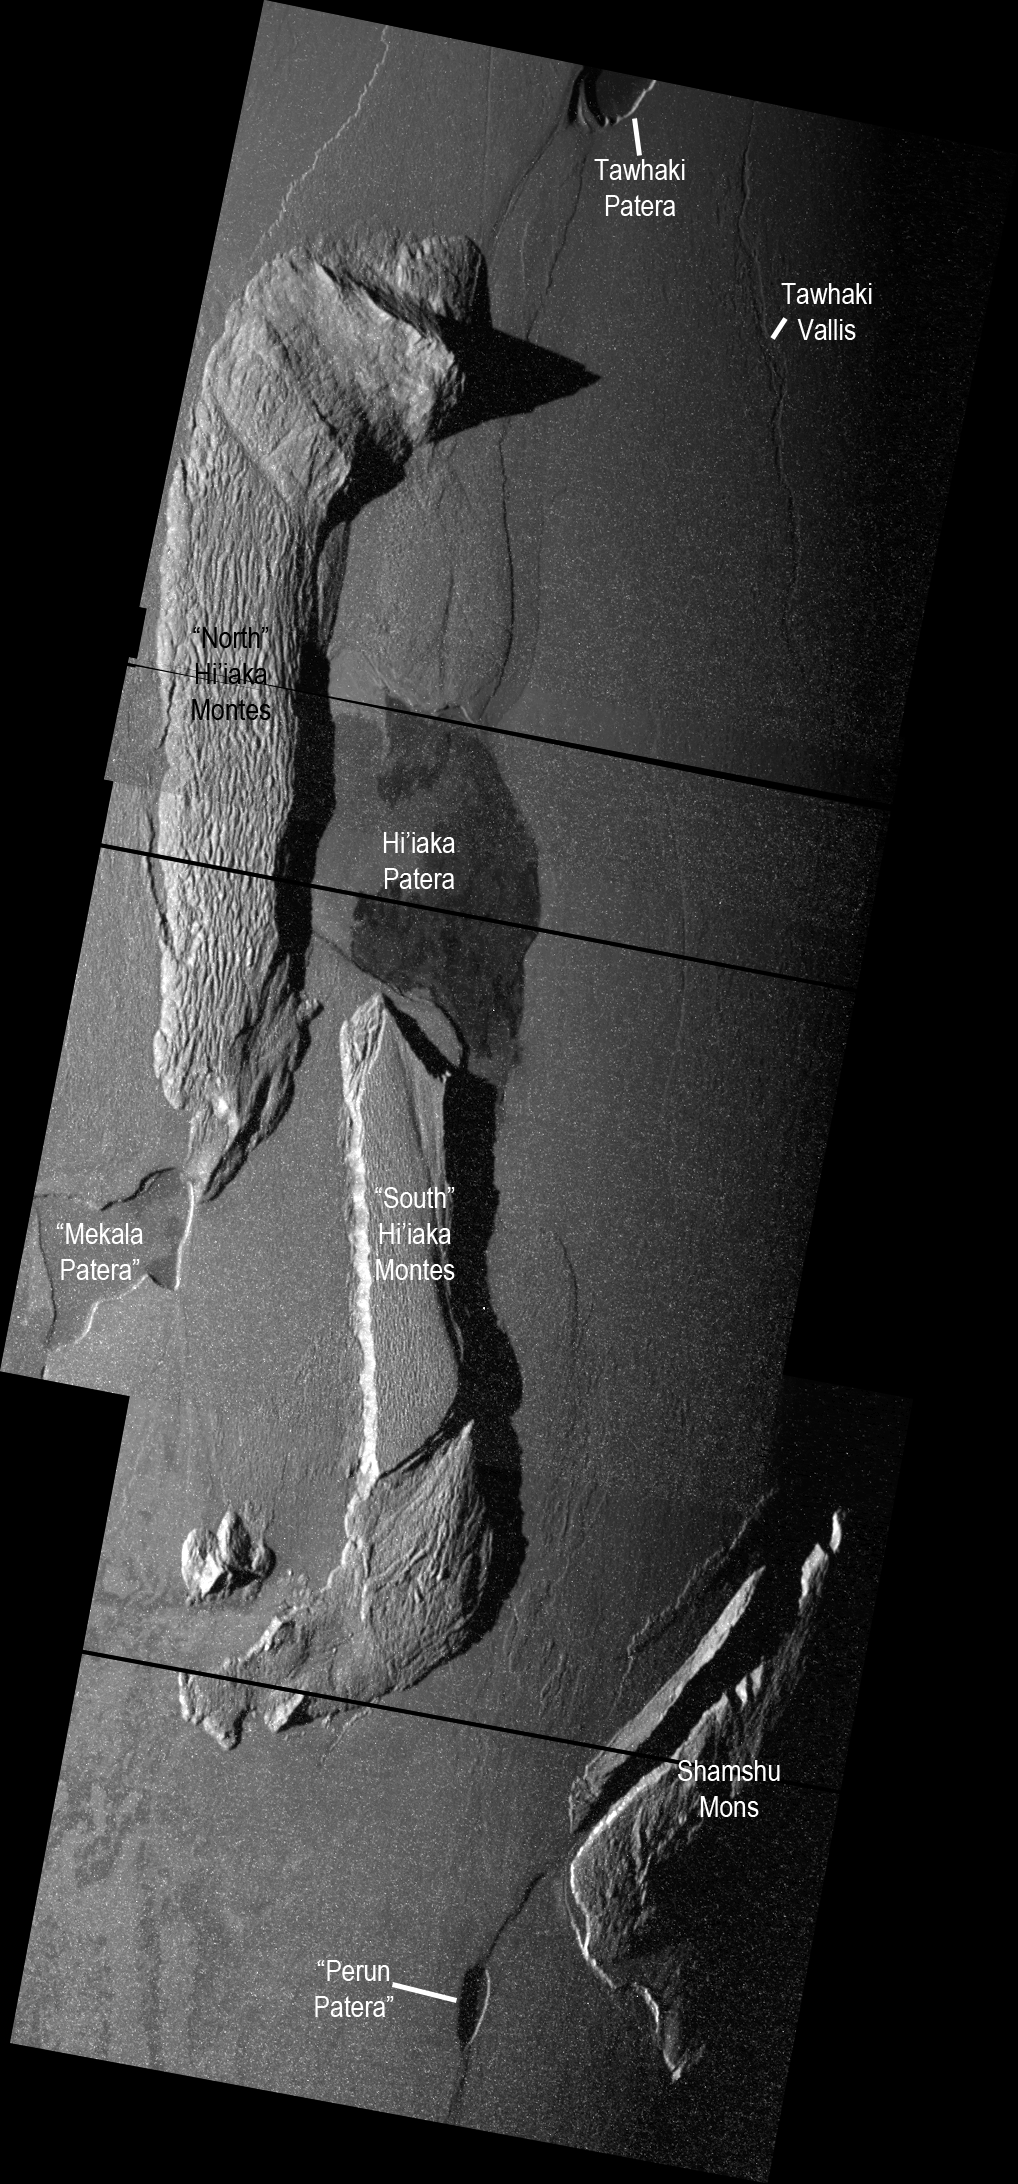
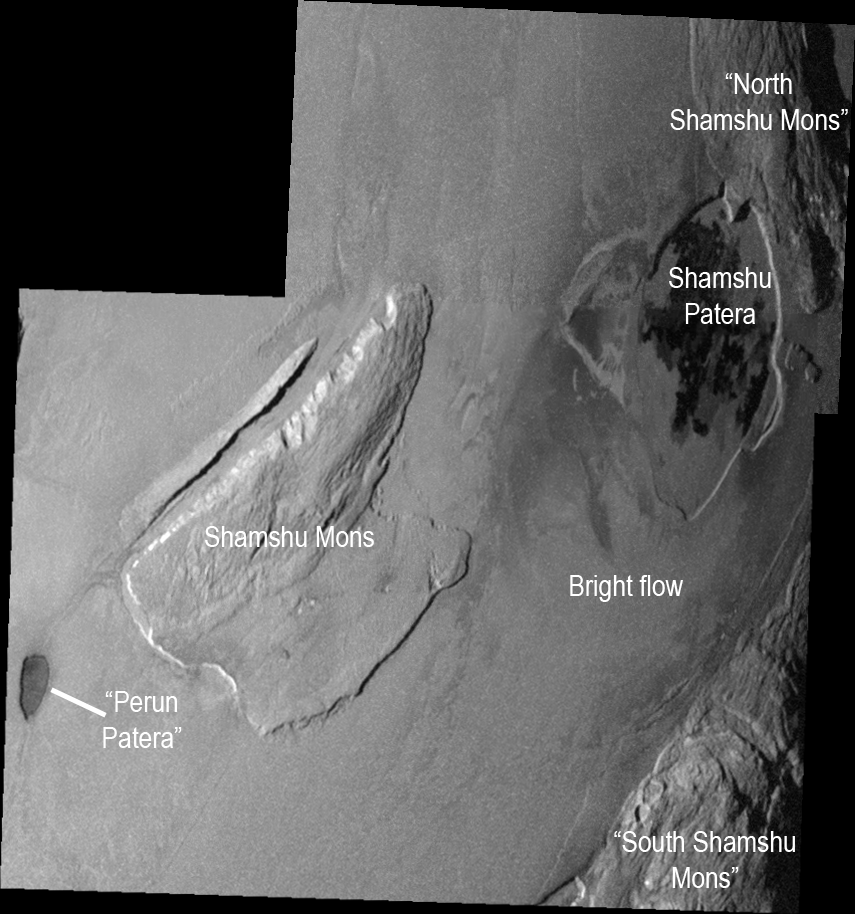
On Friday, a new paper was published in press in the journal Icarus titled, "Geologic mapping of the Hi’iaka and Shamshu regions of Io".  In press articles are those that have been reviewed and approved for publication, but have not yet been published in the print journal.  This paper, by Melissa Bunte, David Williams, Ronald Greeley, and Windy Jaeger.  This paper discusses the results of a geologic mapping project based on the 25ISTERM__01 mosaic of the Hi'iaka region and the 27ISSHMSHU01 mosaic of Shamshu region [I've also uploaded labeled versions of these two mosaics, Hi'iaka and Shamshu, to help people with this discussion].  These two regions are dominated by a patera with a floor partially covered in dark lava flows surrounded by several large mountains.  This paper is part of a series of geomorphologic mapping projects using medium-resolution Galileo mosaics of Io for their basis.  We previously covered papers discussing maps of Prometheus and Zal.  Other regions mapped by the ASU group include: Chaac-Camaxtli, Culann-Tohil, Zamama-Thor, and Amirani-Skythia-Gish Bar.  In March, I covered this group's LPSC abstract covering the mapping of Hi'iaka and Shamshu, so bare with me if I repeat some things from that post..

For this paper, the authors created two geomorphologic maps of the regions surrounding Hi'iaka and Shamshu Paterae, two volcanoes near Io's equator on the leading hemisphere.  These maps were based primarily on two SSI mosaics from Galileo's I25 and I27 encounters with Io in November 1999 and February 2000, respectively.  Color information and low phase brightness information was taken from the global color mosaic produced by the USGS.  Geomorphologic maps are a type of geologic maps where different surface units are identified and mapped so that relationships between these different units can be identified.

In the case of the Hi'iaka and Shamshu regions, four basic units types were identified: plains material, mountain/plateau materials, patera floor materials, and lava flow materials.  These units were also identified in the mapping of other regions on Io, though diffuse material, recent surface coatings that are derived from volcanic or sapping processing and identified in other mapped regions, was not identified in the Hi'iaka and Shamshu regions.  It should be noted though that diffuse materials are often transient; red diffuse material was observed in a faint partial ring of material surrounding Hi'iaka during Galileo's first orbit of Jupiter, suggesting the presence of a plume at Hi'iaka shortly before June 1996.

These four basic units were further sub-divided into different sub-units based on their albedo, color, surface texture, or structural contacts.  For example, mountain units are divided into lineated (ridged/grooved material, generally found at higher altitudes, bounded with plains by scarps), mottled (hummocky, often with lobed margins), undivided (intermediate in texture and altitude between the mottled and lineated types), and plateau (flat-lying terrain with smooth or hummocky textures) types.  Based on the spatial relationships between these units, the authors theorize that these types represent different stages of degradation on Io's mountains.  Lineated mountain units tend to be higher standing and have sharper unit contacts with the surrounding plains, suggesting that terrains of this unit have undergone the least amount of degradation.  The ridges and grooves, such as those seen above at north Hi'iaka Montes, are the result of down slope slumping of a mobile surface layer atop the mountain (see Jeff Moore's 2001 paper on slope degradation on Io).  Remember that mountains are thought to be tilted crustal blocks, the ridged and grooved top surface of the mountain is the result of the upper few kilometers of the mountains, which is a mix of basalt and sulfurous materials that was once part of the upper few kilometers of Io's flat plains.  Once that upper layer sloughs off, the unit transitions to the undivided or mottled types (though the mottled types are likely a mix of old mountain and the mass wasted materials surrounding the mountain).

A similar age progression in sub-units was also noted in patera floor and lava flow materials based on color and albedo (for dark flow/patera floor materials, darker equals younger).  The paper only mentions briefly the debate whether some bright or yellowish lava flows are primary or secondary sulfur flows, or silicate flows with chemical altered surfaces.  The authors (and I agree) that these flows are likely old silicate flows.  This supported less in this region but at Thor, where an outburst eruption generated lava flows that overlapped those of an older, yellowish flow.  Exceptions to this could include a bright white flow to the south of Shamshu Patera and the orange floors of "Mekala Patera" and western Hi'iaka Patera, which could be due to mobilized sulfur dioxide and sulfur, respectively.

As I mentioned in my post from March on the researchers' LPSC abstract on this subject, the authors examined the hypothesis that the three mountains that surround Hi'iaka Patera had at one point been part of a single structure that had split apart as a result of strike-slip and extensional faulting.  This fault would have also resulted in the creation of pull-apart basins that would become Hi'iaka Patera and orange-color patera to the lower left of north Hi'iaka Montes (named Mekala Patera in the paper).  The authors note that the freshest lava flows on the floor of Hi'iaka appear to emanate from the eastern and southern margins of the patera, a pattern consistent with this break-up scenario.  This model of regional-scale plate tectonics was also applied to the mountains in the Shamshu region (with Shamshu Patera being presented as a pull-apart basin) with less convincing results, but it does suggest a new line of investigation to see just how prevalent this style of plate tectonics is on Io with mountains forming, breaking apart, and shifting around across Io's surface.  How many other close groupings of mountains were the result of a single mountain being broken apart by strike-slip and extensional faulting?  I should note that several Ionain mountains have been observed with canyons running down the centers as a result of extensional faulting, like Ionian Mons (upper left), Mongibello Mons, and Danube Planum.

This paper summarizes the results of geomorphologic mapping of the Hi'iaka and Shamshu regions on Io based on regional-scale imaging by Galileo, finding units consistent with those found in other regional mosaics of the satellite.  The geologic history of these regions based on their mapping supports earlier research into this area by authors like Turtle et al. 2001 and Jaeger et al. 2001 that Hi'iaka Patera formed as the result of Hi'iaka Montes breaking apart by strike-slip and extensional faulting.  Magma then ascending to the surface using these same faults that bounded the pull-apart basin.  At this point, the volcanic activity at both Hi'iaka and Shamshu appear to be dominated by compound lava flows, unlike the lava lakes seen at Pele and Loki.  The mountains were then further degraded by gravitational mass wasting, SO2 sapping from ice layers within the mountain, and thermal erosion from nearby volcanoes.  Thermal erosion by flowing lava is thought to be responsible for Tawhaki Vallis, a channel observed to the right side of the image at top, as proposed by Schenk and Williams 2004.  Each of mountains in the region exhibit signs of degradation, from the ridges and grooves atop north Hi'iaka Montes and north Shamshu Montes, indicative of a slumping mobile surface layer, to hummocky-textured and lobe-edged landslide deposits, indicative of gravitationally- or sapping-induced mass wasting.

I think that leaves one more region to map, Tvashtar.

Link: Geologic mapping of the Hi’iaka and Shamshu regions of Io [dx.doi.org]

Friday, December 11, 2009

A Few New Io/Jupiter System Papers

Sorry for the hiatus there is posts over the last couple of months.  I've just been a bit busy with Cassini plus I wanted to take a bit of a break after posting so much in September and October.  I wanted to post a quick note letting you all know about three new Io/Jupiter System related papers currently in press in the journal Icarus.

The first is titled, "Geologic mapping of the Hi'iaka and Shamshu regions of Io" by Melissa Bunte, David Williams, Ronald Greeley, and Windy Jaeger.  This paper is the latest in a series that covers the geologic histories of some of the regions observed at high- and medium-resolution by Galileo during its flybys in the late 1990s and early 2000s.  Back in March, I covered the authors' LPSC abstract on this research so you can read up on that while I slowly get through this paper and post a summary over the weekend (hopefully, there is a major Titan flyby today whose data comes back Sunday morning).

The other Io paper is titled, "Multi-wavelength simulations of atmospheric radiation from Io with a 3-D spherical-shell backward Monte Carlo radiative transfer model" by Sergey Gratiy et al.  Yeah, that's going to take me a bit longer to get through.  Hopefully I can post something next week.

The final paper that caught my eye in Icarus is titled, "Global geological mapping of Ganymede" by G. Wesley Patterson et al.  This paper discusses the completed Ganymede global geologic map and presents research on the observed geologic units on that satellite.  Again, I've only flipped through the article, and maybe later this month I can write up something about it.

Thursday, September 17, 2009

Paper: Spectroscopy of Io Eclipse Reappearances

Last week, a new paper was published in press (the paper has been approved for publication, but hasn't found a slot in the dead-tree version of the journal yet) in the journal Icarus discussing spectroscopic observation of Io as it emerged from the shadow of Jupiter. The paper is titled "Eclipse reappearances of Io: Time-resolved spectroscopy" and was written by Dale Cruikshank, Josh Emery, Katherine Kornei, Giancarlo Bellucci, and Emiliano d'Aversa.

In this new paper, the authors discuss spectroscopic observation of Io acquired using NASA's Infrared Telescope Facility (IRTF) in Hawaii during five eclipse reappearances in April, May, and June 2004. These observations were intended as a follow-up to results from Cassini VIMS observations in Bellucci et al. 2004 taken during that spacecraft's Jupiter flyby during New Year's 2001 that showed a brightening of Io's surface in the near-infrared and a deepening of several strong sulfur dioxide absorption bands following Io's emergence from Jupiter's shadow. This result continues a 40-year-long mystery concerning the interaction between Io's atmosphere and its surface during and after an eclipse by Jupiter.

Unlike lunar eclipses, when the Earth passes between the Sun and our Moon and which happen about once a year, or every 13 orbits of the Moon around the Earth, eclipses of Io by Jupiter occur about once each Ionian day. This is due the large size of Jupiter compared to Earth and the much lower axial tilt of Jupiter and its main satellite system. Each Ionian lunar eclipse lasts about 2 hours and 22 minutes. During this time, the temperature of Io's surface cools due to the sudden lack of sunlight. As Io cools down as the eclipse progresses, atmospheric Sulfur dioxide (SO2) condenses onto the surface. Check out a post I wrote earlier this year on another paper for more details on this process.

Depending on the amount of SO2 that condenses onto the surface, the fresh frost should be visible shortly after Io emerges from behind Jupiter's shadow as a brightening of Io's surface compared to its appearance prior to being eclipsed, and it should quickly dim as the frost sublimates from the surface now that the Sun is able to heat it up. In addition, the strong SO2 absorption bands at 3.56 μm, 3.78 μm, 4.07 μm, and 4.37 μm would be deeper than they were prior to the eclipse and should become shallower during the first 60-90 minutes after each eclipse and particularly in the first 15 minutes as the fresh, fine-grained SO2 frost sublimates back into the atmosphere. Results from multiple studies using ground-based and spacecraft observations over the last 40 years, since Binder and Cruikshank 1964 revealed a brightening of Io of 10 percent following an eclipse by Jupiter, have been inconsistent with some showing such a brightening, and others showing none. As explained in this new paper, Nelson et al. 1993 found that post-eclipse brightenings are likely to be rare as a fresh SO2 frost layer several millimeters thick would be required to explaining the magnitude of the brightenings that were seen, and it would take longer than 15 minutes to sublimate that layer away. In addition, modeling of Io's atmosphere during an Io eclipse by Moore et al. 2009 suggests that SO2 condensation onto the surface would be curtailed to some degree by atmospheric heating by the Io plasma torus and by non-condensable species like Sulfur monoxide preventing SO2 in Io's upper atmosphere from condensing.

Cruikshank et al. examined their observations taken at IRTF and found no evidence of changes in Io's albedo or the area of three SO2 absorption bands at 3.56 μm, 3.78 μm, and 4.07 μm. What changes were observed were either the result of the rotation of Io during the 60-90 minutes of each observation run, were found in one absorption band but not in the other three, or were the result of observation noise or the thick airmass of Earth's atmosphere. Therefore, the authors were not able to confirm the VIMS results published by Bellucci et al. 2004. The authors suggested that the two conflicting results could be due to the background frost coverage in the area observed by the two groups of researchers. VIMS observed Io's trailing hemisphere which is thought to have the least abundant SO2 frost coverage while the Cruikshank et al. group observed the sub-Jupiter hemisphere, SO2 abundance is higher. The lower SO2 abundance would have made condensed SO2, even if in a very thin layer, more noticeable compared to the sub-Jupiter hemisphere.

In other results, Cruikshank et al. observed additional SO2 absorption bands between 2.11 and 2.24 μm, including a faint one at 2.198 μm that the authors thought they were first to see in Io's near-infrared spectrum. Another weak absorption band at 2.1255 μm was mapped by Laver and de Pater and the results of that study were published earlier this year and discussed on this blog. Cruikshank et al. also observed Io's emission spectrum while the satellite was still in the shadow of Jupiter during the observation run on June 22, 2004. They did not find convincing evidence for condensed SO2 in Io's atmosphere, which would be expected in Io's volcanic plumes. This negative result could be the result of the temporal variability of Io's plumes.

Finally, the table of contents for the October 2009 issue of Icarus has been published online. No Io-related papers in this issue, but there are a series of papers covering Jupiter's Oval BA, also known as Red Spot Jr.

Link: Eclipse reappearances of Io: Time-resolved spectroscopy (1.9-4.2 μm) [dx.doi.org]

Wednesday, July 8, 2009

Paper: Heat Flow from Io's Dark Lava Flows

A new Io-related paper in the journal Icarus was posted online on Sunday titled, "Io: Heat Flow from Dark Volcanic Fields." The paper is authored by Glenn Veeder, Ashley Davies, Dennis Matson, and Torrence Johnson. The authors in this paper attempt to estimate the amount of Io's overall heat flow that is radiated from the large volcanic lava flow fields that cover a sizable portion of Io's plains, distinguishing these features from the myriad of volcanic pits, the background heat flow, and the big daddy of Ionian volcanoes, Loki Patera, which by itself radiates 5-15% of Io's total heat flow. This research was previously discussed last year on this blog when the authors of this paper submitted a print-only abstract to LPSC 2008.

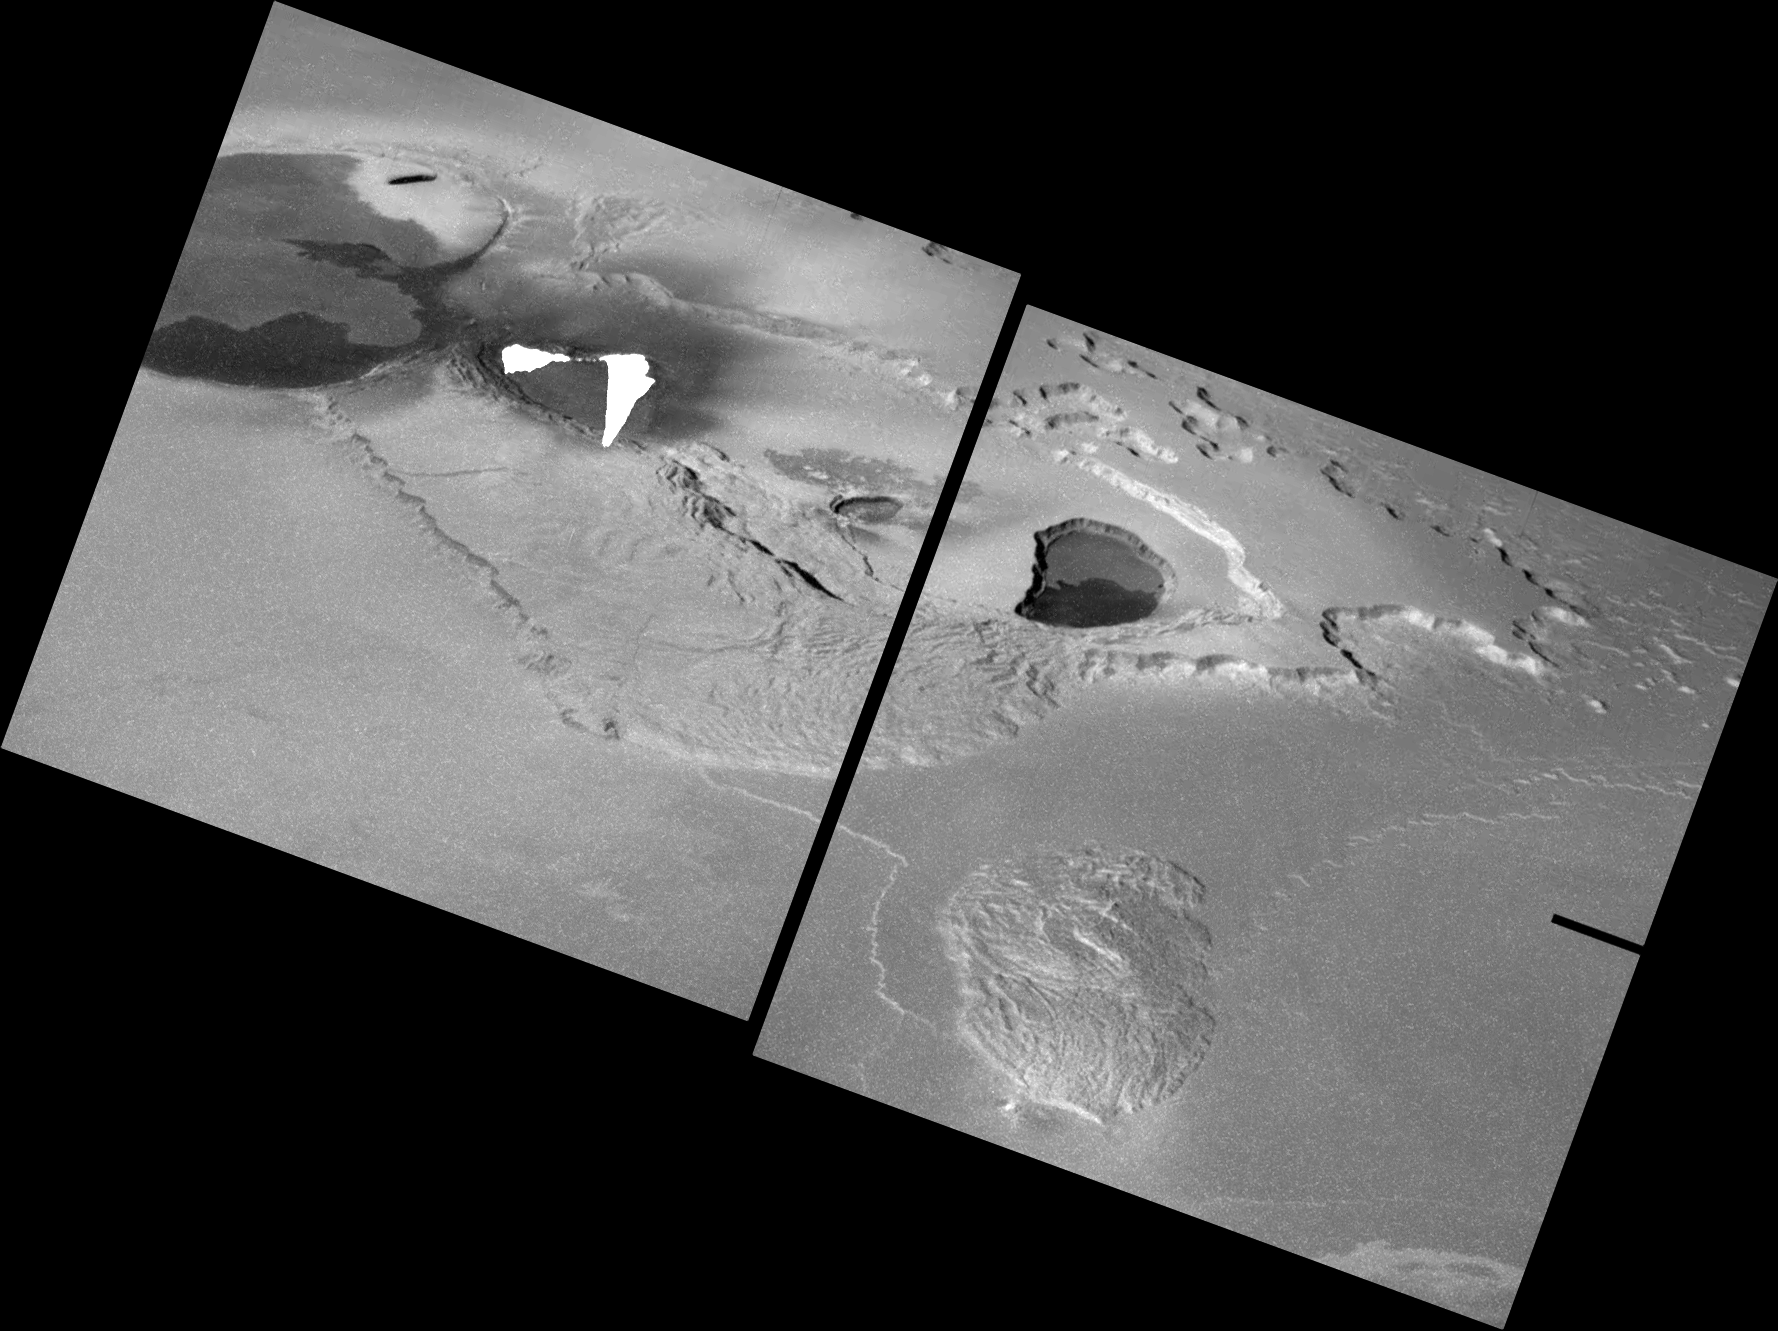
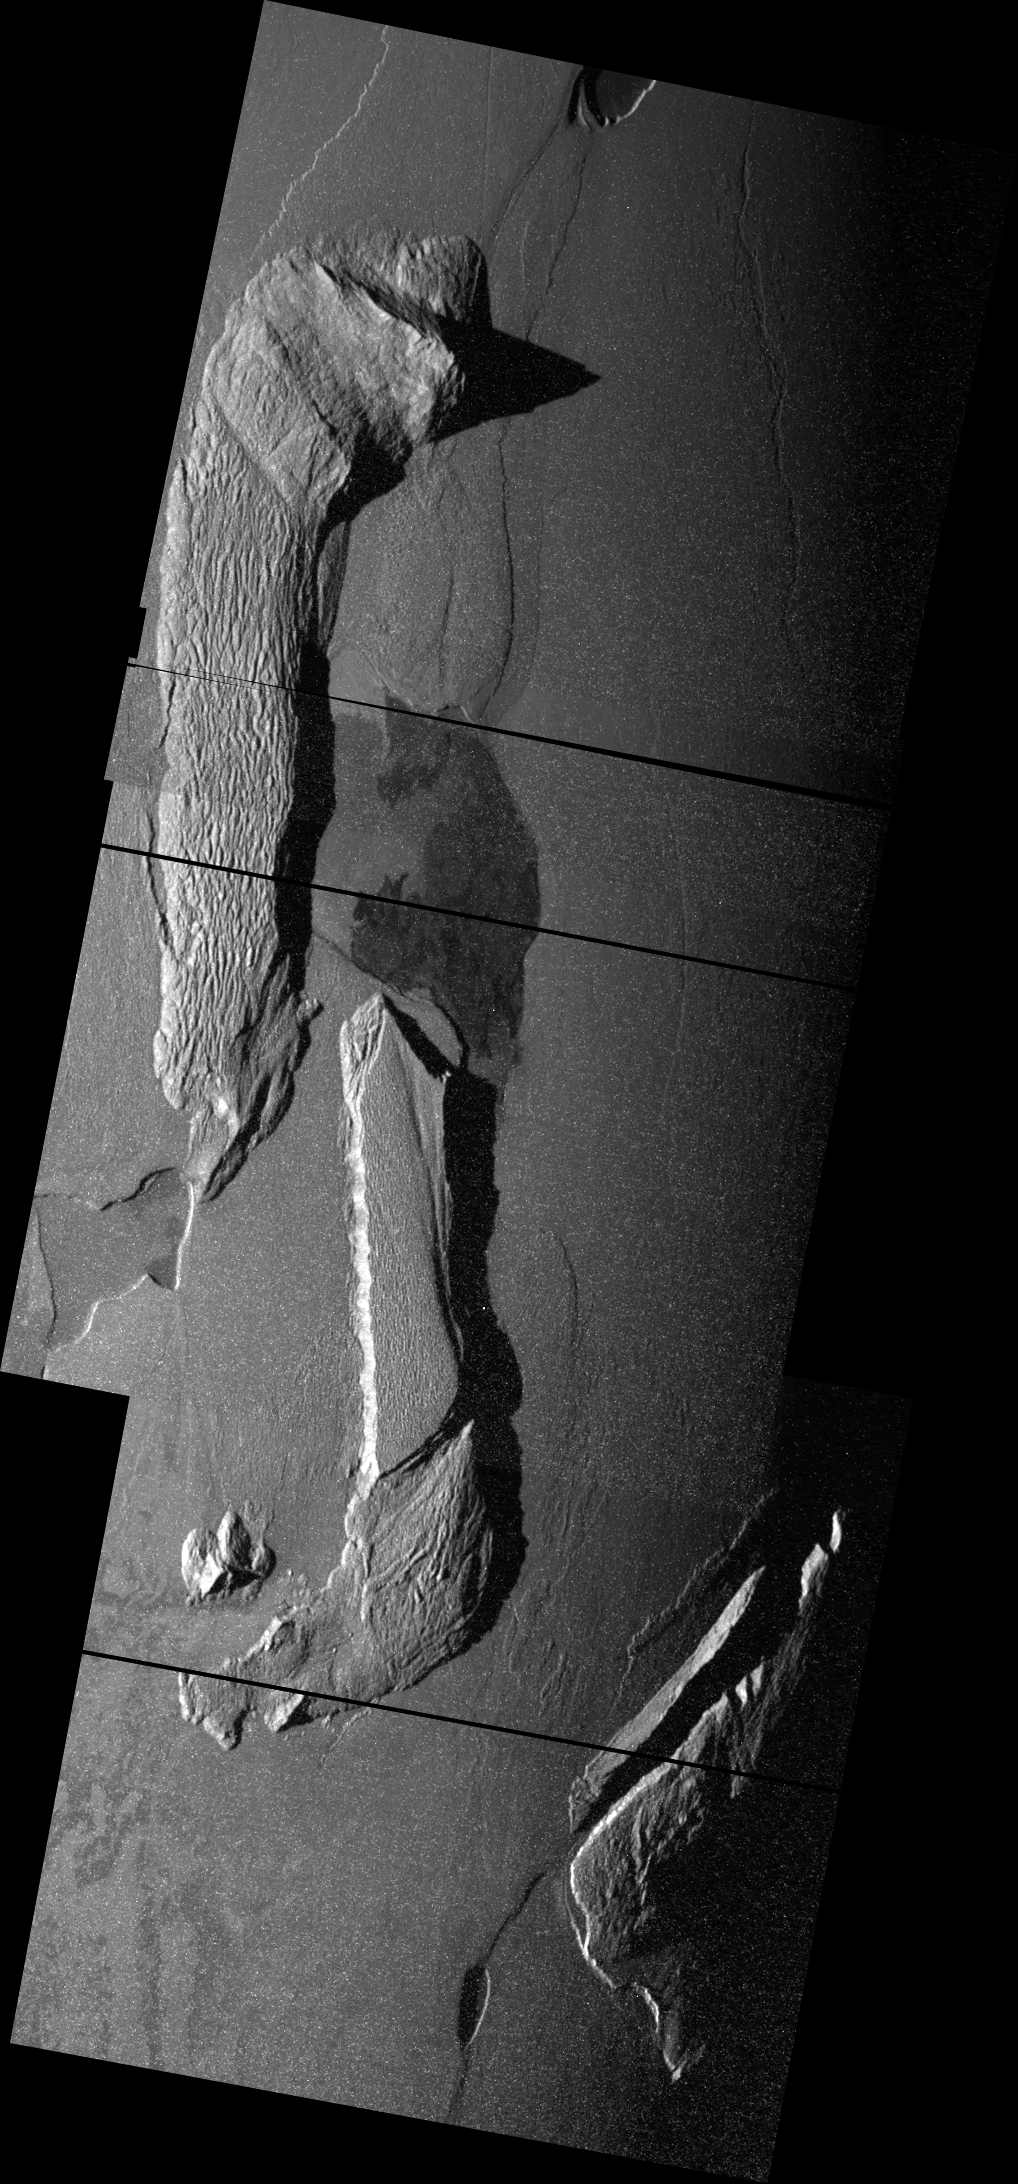
Dark volcanic fields on Io are thought to consist of recently active, compound silicate lava flows that have erupted onto the plains of Io, rather than being confined within a patera (volcanic pit). Lava flows of many colors have been observed on Io, but it is the black or dark green flows that are thought to be the most recently active silicate flows. These flows tend to be lava channel (or tube)-fed, with smaller outbreaks building and growing the flow field over time. For example, if you look at Amirani above, you see "small", fresher lava flows on top of older, dark green lava. The dark green color comes from the deposition of sulfur on still-cooling, iron-rich silicate lava flows, producing iron sulfide. Brighter flows represent either older silicate flows that cooled enough for sulfur and sulfur dioxide to condense on their surfaces or sulfur-rich lava flows. Either way, bright flows were not considered in this analysis.

Veeder and his colleagues estimated the contribution of Io's dark lava flow fields to Io's total heat flow by first identifying all the dark lava flow fields visible on Io in the USGS global map and calculating the area of each flow field. Their areas were found by measuring the number of pixels below a threshold limit for each dark flow field (the threshold valuing varying with each flow field) while also removing other possible dark features such as paterae. Using this method, the authors identified 28 dark flow fields, including features such as Masubi Fluctus, Marduk Fluctus, Amirani (above left), and Prometheus (above upper right), covering slightly less than 1% of Io's surface. The authors also excluded more transient lava flows like Pillan and Thor, though sources such as these may provide a significant amount of the heat flow contribution from dark flow field heat, even if the specific sources changes over time. The authors then seem to be more focused on persistent volcanoes. The authors note a peak in the distribution of dark lava flows in the anti-Jovian hemisphere of Io, opposite Io's most powerful volcano, Loki Patera.

Next, the authors estimated the effective temperature (akin to an average nighttime temperature of each lava flow) and the total radiating power for each flow. For many of the flows, infrared data, either from the NIMS or PPR instruments on Galileo, is available, allowing for a more accurate estimate of the heat flow of each flow. For cooler flows, more accurate estimates tend to come from the PPR data since much of their heat is radiating out at longer infrared wavelengths to which PPR was more sensitive, compared to NIMS, which was more sensitive to warmer heat sources. However, for more than half of the dark lava flows examined in this study, no radiative power estimate is available. For these flows, the authors assumed an effective temperature of either 130 K or 115 K, depending on whether surface changes or other signs of recent volcanic activity have been observed.

The authors' estimate that the 28 dark flow fields they examined provide 5 x 10¹² Watts to Io's global heat flow, or about 5% of Io's total heat flow. This amount is similar to Loki when it is quiescent. While their effective temperatures are cooler than many of Io's active paterae like Loki Patera or Pele, their larger surface area compared to Loki Patera (an order of magnitude greater) allows them to contribute a large amount of Io's heat flow. It should be noted that this analysis excluded brighter flows, which may provide an even greater percentage of Io's total heat flow despite having even cooler effective temperatures, a possible later research subject as Io's heat flow budget is broken down further (to an extent this has with Glenn Veeder's earlier work on the possible excess heat flow from Io's polar regions).

Link: Io: Heat Flow from Dark Volcanic Fields [dx.doi.org]

In other news, the blog Kentucky Space has the latest edition of the Carnival of Space. Worth checking out to get yourselves caught up on the celestial blogosphere.

Monday, February 23, 2009

Paper: Formation of Mountains on Io

The second Io paper posted Saturday on the journal Icarus's Articles in Press page is titled, "Formation of mountains on Io: Variable volcanism and thermal stresses". The authors for this paper are Michelle Kirchoff and Bill McKinnon from the Lunar and Planetary Institute in Houston and Washington University in St. Louis. This paper takes a look at the geophysics behind the formation of mountains on Io and why there is a global scale anti-correlation between mountain and volcanic paterae. In a nutshell, they find that variations in volcanic activity can vary the level of thermal stresses in Io's lithosphere, which in concert with subsidence stress (a compressive stress that increases with depth resulting from the high resurfacing rate), leads to the formation of thrust faulting and mountains if that volcanic activity decreases.

Crustal subsidence stress from volcanic resurfacing is one of the dominant compressive stressors on the Ionian lithosphere, but subsidence stress is insufficient to produce thrust faults that reach the surface as each time a fault is formed and moves, the subsidence stress global is that much more reduced. In order for a mountain or a cluster of mountains to be formed at a particular location, a "focusing" mechanism is required. Three hypotheses have been put forth for these mechanisms:
  • Jaeger et al. 2003 suggested that mantle plumes impinging on the base of the lithosphere could locally increase the compressive stress at a particular location, resulting in thrust faulting and mountain formation. Kirchoff and McKinnon call this hypothesis "plume-modified subsidence."
  • Tackley et al. 2001 suggested that global mantle upwellings and downwellings produce tensile and compressive stresses in the crust. Upwellings results in tensile (extentional) stress on the lithosphere due to crustal thinning and stretching, producing increased volcanic activity. Downwellings result in compressive stress on the lithosphere, producing increased mountain formation. This model was developed in response to the obsevation that while some paterae abut mountains and thus there maybe some local correlations between mountains and volcanic pits, globally these features are anti-correlated. The authors of this paper call this hypothesis "Convection-modified subsidence".
  • McKinnon et al. 2001 suggested that decreases in volcanic activity on a regional scale (and thus decreasing the transport of heat from the interior to the surface), could result in heat building up at the base of the lithosphere, causing it to melt. The increase in thermal stresses caused by this melting result in the propagation of thrust faults closer to the surface and would thus support mountain formation (also known as orogenesis). Kirchoff and McKinnon call this hypothesis "thermal-stress-modified subsidence".
The authors examined the viability of the "thermal-stress-modified subsidence" hypothesis by modeling temperature and stress levels within the lithosphere, first assuming a steady-state resurfacing rate (which, according to the O'Reilly and Davies 1981 heat pipe model, is directly related to heat flow; the advective escape of heat from Io's interior). They then increased or decreased that resurfacing rate by 50% and 100% to see how this affected the temperature and stress levels. Kirchoff and McKinnon looked at both cases where the asthenospheric heating rate and resurfacing rate are coupled and uncoupled. In the coupled case, a decrease in resurfacing rate is the result of a decrease in the local asthenospheric heating rate. In the uncoupled case, the local asthenospheric heating rate stays the same while the amount of heat that is advected to the surface (through volcanism) is varied.
  • In the coupled case, the thickness of the lithosphere is maintained. Temperatures in the lithosphere increase, causing the region in compressive failure (where stresses surpass Byerlee's Rule) to become larger and more shallow. Eventually the temperatures and stress levels reach a steady state.
  • In the uncoupled case, decreasing the resurfacing rate increased heating at the base of the lithosphere, leading it to melt and increasing temperatures throughout the lithosphere (though convection all the way to the surface remains negligible). Over 0.5-1 million years, the crust thins. The resulting thermal stress decreases the depth at which thrust faults could form and propagate. The more the resurfacing rate is reduced, the greater the effect. Increasing the resurfacing rate causes cooling at the base of the lithosphere, thickening it. No steady state is achieved, eventually something has to give, like an increase in volcanic activity.
  • The authors also looked at a case where the lithosphere is 50 km thick, instead of 25 km. This just increases the time it takes for the lithosphere to thin enough to bring the brittle compressive zone close enough to the surface to support orogenesis.
Kirchoff and McKinnon ignored the effects of warm intrusions (which are likely important in formation of paterae) and assume that old lava flows completely cool before the next is laid down and the presence of a partially molten asthenosphere. The thermal effects of the first two are likely negligible as they don't seem to be a major component of the heat flow (heat flow estimates at longer and shorter wavelengths are consistent). The third is consistent with most modern tidal heating models for Io given volcano distribution. They also found that changing crustal rheologies (dry basalt, peridotite, or "komatiite") doesn't greatly change the modeling results. Eruption temperature estimates are consistent with dry basalt with greater iron and magnesium (olivine) content.

The authors then compared their results to the other models. For the plume-modified subsidence hypothesis, stress caused by an impinging mantle plume was not significant compared to crustal stresses. Because tidal heating is focused in the asthenosphere (or upper mantle), heat "plumes" should be downwellings, not upwellings, according to Tackley et al. 2001. For the convection-modified subsidence hypothesis, compressive stress on the lithosphere from mantle downwellings are too small to focus mountain formation. Maximum lithospheric stress are only a few kPa, compared to hundreds of MPa needed for compressive failure.

Finally, the authors examine a potential local cycle of mountain and volcano formation. First, greater volcanic activity increases the resurfacing rate (and thus the subsidence rate). This causes greater compression at depth, which constrains the deep conduits between volcanoes and their deep magma reservoirs, lowering the level of volcanic activity. This does nothing to the level of asthenospheric heat and temperatures increase throughout the lithosphere, leading to melting at its base. This melting causes thermal stresses to propagate to shallower depths, causing compressive failure between 10-20 km, where thrust faults could propagate to the surface, forming mountains. The formation of these faults and mountains relieves the subsidence stresses and thermal stresses in the lithosphere, leading to extension. This then allows magma to ascend to the surface through newly opened conduits as well as form batholiths which can helps deform mountains, such as by fracturing them. Increasing volcanic activity leads to a thickening of the crust back to its normal level. Unlike the view from McKinnon et al. 2001, volcanism does not need to complete shut down for this model to work.

One potential consequence of this cycle is that areas with high numbers of mountain should be beginning to increase their level of volcanic activity, perhaps increase the number of active paterae that abut mountains compared to areas with more paterae but fewer mountains.

Link: Formation of mountains on Io: Variable volcanism and thermal stresses [dx.doi.org]

Sunday, February 22, 2009

Paper: Io's Dayside SO2 Atmosphere

As I pointed out yesterday, two papers were added to the journal Icarus's Articles in Press. The first that I want to summarize here is titled, "Io's Dayside SO2 Atmosphere." The authors of this paper are Lori M. Feaga, Melissa McGrath, and Paul D. Feldman. The authors of this paper examined far-ultraviolet data acquired by the STIS instrument on the Hubble Space Telescope between 1997 and 2001 to see what this dataset can tell us about the density of Io's atmosphere and how it varies across Io's disk.

During the Galileo mission, the Hubble Space Telescope was tasked at various times between 1997 and 2001 with observing Io during the telescope's Space Telescope Imaging Spectrograph (HST/STIS). Feaga et al. took a look at the data in the range of the HI Lyman-α line (around 1216 Å or 121.6 nm) and studied the spatial and temporal variations of that spectral line's emission from Io's surface. This research builds on previous work by Feldman et al. 2000 that found that the level of emission in this far-ultraviolet spectral line is related to the column density of the atmosphere. Gaseous sulfur dioxide is a continuum absorber in this region of the spectrum, so as the column density of the SO2 in Io's atmosphere increases, less of the Lyman-α emission from the sun reaches the surface and is reflected back into space for the HST to observe it. Looking at an example image above, the dark regions on Io's disk (marked by the white circle) are places where Io's atmospheric SO2 is densest and bright areas are where gaseous SO2 is less dense. Feldman et al. 2000 found that Lyman-α emission from Io peaks at the satellite's mid-latitudes and is lowest within the equatorial region, suggesting a latitudinal dependence on the density of Io's atmosphere.

This new paper by Feaga et al. continues the research started in the 2000 paper by looking at the more complete HST/STIS dataset covering a greater longitude range than the earlier work by Feldman et al. This allowed the authors to look into spatial and temporal variations in the SO2 column density. The authors found that Io's atmosphere, in addition to the latitudinal dependence also seen in the earlier work, was densest and had the greatest latitudinal extent on Io's anti-Jovian hemisphere (particularly at the longitude range of Bosphorus Regio) and was narrower in latitudinal extent and less dense on Io's sub-jovian hemisphere. The greatest SO2 column density was seen near 140° at 5 x 1016 cm-2. However, they do note some limitations for their method for deriving SO2 column densities. For example, the densities near the equator are often high enough that the amount of signal from the surface is quite low, low enough to be effected by some of their data reduction procedures, such as removing the Lyman-α emission from the interplanetary medium and removing the effect of albedo variations on Io's surface (their albedo map comes from a nearby wavelength range and was scaled to the extected brightness range expected at 1216 Å). They found few examples of major changes in the density and extent of Io's atmosphere, suggesting that the atmosphere is stable over periods of five years or more.

The authors also looked at how their gaseous SO2 map with the distribution of volcanic hot spots and plumes as well as the distribution of sulfur dioxide frost on Io's surface as found by Doute et al. 2001. They argue that from these comparisons that their results best support a volcanically-driven atmosphere, as the equatorial and anti-jovian concentrations of gaseous SO2 is best comparable with their map of hotspots and plumes. However, it should be noted that their map is still consistent with the distribution of large-grained SO2 as found by Laver and de Pater 2009. In a sublimation-driven atmosphere, SO2 frost in the warmest regions of Io (the equatorial regions) would be the source, so the Laver and de Pater map maybe more relevent for comparison. In addition, in a volcanically-driven atmosphere, I would have expected more examples of changes as the result of variations in volcanic activity, though a few possible examples were found at Pele and Prometheus.

Finally, the authors looked at how their data compares to other measurements made by other researchers. They found that their distribution map is similar to what others have found with Io's anti-jovian hemisphere having a greater latitudinal extent and column densities of SO2 gas than the sub-jovian hemisphere and with greater SO2 column densities near the equator compared to the mid-latitudes and polar regions. They found that column density numbers, particularly in the equatorial regions, tended to be lower than other authors, such as Jessup et al. 2004 and Moullet et al. 2008. The authors suggest that the low signal-to-noise ratio within the equatorial region may make some of the measurements lower limits, though they may not be consistent with some results from Spencer et al. 2005, which predicts much higher column densities at mid-latitudes than what was found in the HST/STIS data.

Link: Io's Dayside SO2 Atmosphere [dx.doi.org]

Saturday, February 21, 2009

Two New Io Papers In-Press

There are two new Io-related papers just posted to Icarus's Articles-in-Press page. In Press articles are papers that have been approved for publication but have not found a spot in the printed journal. The first paper, Io's dayside SO2 atmosphere by Lori M. Feaga, Melissa McGrath, and Paul D. Feldman, covers Hubble Space Telescope observations of Io's atmosphere in the UV. The second paper, Formation of mountains on Io: Variable volcanism and thermal stresses by Michelle R. Kirchoff and William B. McKinnon, reports on modeling of Io's lithosphere and how its tectonics varies as a result of volcanic variability.

I'll post summaries of these two papers here tomorrow and Monday.

Saturday, January 24, 2009

Paper: Io's atmospheric dynamics during and after eclipse

Published today in the journal Icarus's Articles in Press page is a new article by Chris Moore, D. B. Goldstein, P.L. Varghese, L.M. Trafton, and B. Stewart titled, "1-D DSMC Simulation of Io's Atmospheric Collapse and Reformation During and After Eclipse." Note that this article requires a personal or institutional subscription to access. The article presents a computer model of Io's atmosphere during an eclipse of the Sun by Jupiter and how non-condensable chemical species in the atmosphere effect gas number densities and collapse times.

Io's thin atmosphere is primarily composed of Sulfur dioxide (SO2), a chemical that also dominates Io's volcanic gases and great gray-white snow fields. The atmosphere of Io is basically in equilibrium vapor pressure with the surface. In other words, the colder the surface temperature, the more SO2 that is condensed out on the surface. The warmer the surface temperature, the more SO2 that sublimates into the atmosphere. In addition to SO2, Sulfur monoxide (SO) and molecular oxygen, disassociative products of SO2, are also present in the atmosphere at much smaller mole fractions.

The sudden onset of eclipse for the sub-Jupiter hemisphere brings dramatic surface temperature changes and with it atmospheric changes. Before an eclipse, the molecules (within one scale height of the surface, or 10 km) are well mixed with about 80% SO2 and 20% non-condensable species like SO and O2. Above 10 km, the molecules are not collisional and therefore have different scale heights depending on molecular weight. The general picture of what happens during an eclipse, as modeled by Moore et al. can be seen in the cartoon at left. As the eclipse begins, a significant amount of the SO2 in Io's lower atmosphere condenses onto the surface as the surface cools rapidly from 120K at the sub-solar point to ~105-110 K. SO2 in the upper atmosphere does not condense out because of the lag time for the upper atmosphere to sense the temperature change at the surface. This lag is further complicated by energy supplied by the plasma torus which keeps the upper atmosphere's temperature "artificially" inflated. As the eclipse progresses, more SO2 condenses out, but the rate slows as more plasma from the torus reaches the surface, keeping the temperature of the SO2 in the lower atmosphere inflated above what it normally would be if it were in perfect vapor pressure equilibrium. In addition, SO, enhanced in mole fraction as much of the SO2 in the lower atmosphere has condensed into a frost on the surface, forms a diffusion layer near the surface, preventing SO2 higher up in the atmosphere from condensing out. After the eclipse, the SO2 frost that had condense during the eclipse starts to sublimate. This vertical motion in the atmosphere pushes the diffusion layer SO higher up in the atmosphere. Within 30 minutes of the end of the eclipse, the lower atmosphere consists primarily of SO2 while the upper atmosphere is composed of 70% SO2 and 30% SO. Over the next half day, the atmosphere re-equlibrates back to the situation prior to the eclipse.

While the surface goes through a similar rapid drop in temperature at sunset, the greater length of night and lateral winds mean that the non-condensable species don't have the same effect as they do during an eclipse.

These changes in the atmosphere effect Io's auroral emission, seen in color by Galileo in 1998 (picture shown at top). Most of the auroral emission comes from the upper atmosphere. The fact that upper atmosphere does not condense is consistent with Geissler et al. 2001's observation that the auroral glows observed by Galileo do not dim with time elapsed since eclipse ingress.

Link: 1-D DSMC simulation of Io's atmospheric collapse and reformation during and after eclipse [dx.doi.org]

Friday, January 9, 2009

New Paper: Distribution of SO2 Ice on Io

A new Io-related paper was posted online on the journal Icarus's Article-in-Press page, "The global distribution of Sulfur Dioxide ice on Io, observed with OSIRIS on the W.M. Keck telescope" by Conor Laver and Imke de Pater. This paper covers K-band (1.97-2.38 μm), high-spatial and spectral resolution observations of Io's leading and trailing hemisphere acquired by the OSIRIS near-infrared spectrometer at Mauna Kea's Keck II telescope. This is the third in a series of papers by Laver and de Pater based on observations acquired in April and June 2006. The first paper, published in Icarus in 2007, covered an outburst eruption at Tvashtar Patera in April 2006. The second paper, published in Icarus in 2008, covered observations acquired in April 2006 of SO2 frost distribution across Io's leading hemisphere.

In their most recent paper, Laver and de Pater explore data acquired on June 1 and 2, 2006 to look at SO2 frost/ice distribution across the leading and trailing hemisphere of Io. In particular, they look at two weak SO2 absorption bands at 1.981 μm (3ν1 + ν3 vibrational mode) and 2.126 μm (ν1 + 3ν3). In addition to including coverage over the trailing hemisphere, the data from June have a higher spatial resolution (65 km at Io's equator) than the April data that was the subject of last year's paper. Like the NIMS and VIMS instruments on Galileo and Cassini, respectively, the OSIRIS instrument produces a reflectance spectrum for each of the nearly 2000 pixels that cover the disk of Io. From these reflectance spectra and following some calibration procedures described in the paper, the authors calculated the equivalent width (a method of both measuring the strength of an absorption band and normalizing it to the surrounding continuum) and the Full-width at half-maxium (FWHM; basically the wavelength width of the absorption band in nanometers) for each of the two absorption bands. Based on these calculations, the authors can then measure the fractional coverage of SO2 for each pixel in their map based on the equivalent width and a lower-limit grain size of 700 μm. Theoretically, differences in the FWHM can be used the look at differences in grain size across Io, but the spectral resolution was not high enough to explore this. Based on the observed FWHM and the depths of these bands, a grain size lower limit of 700 μm was determined.

The authors found an enhancement of SO2 frost within Io's bright equatorial regions, such as Bosphorus Regio, Colchis Regio, Tarsus Regio, and Media Regio and a significant deficiency in SO2 frost west and southwest of Pele on Io's trailing hemisphere. The authors compared these results to similar studies conducted using Voyager ISS data (McEwen 1988) and Galileo NIMS data (Carlson et al. 1997 and Douté et al. 2001). The maps created by Laver and de Pater agree fairly well with McEwen and Carlson's weaker band results, but disagree strongly with Douté and Carlson's stronger band results. The differences observed are likely due to the latter maps showing the distribution of small grained SO2 while the results from weaker bands, like those observed by Laver and de Pater, are sensitive to larger grained ice.

The maps by Douté, for example, show higher concentrations of small-grained SO2 at mid-latitudes, particularly north and south of Pele. Laver and de Pater theorize that this difference in the distribution of small- and large-grained SO2 frost results from frost grains annealing in the warmer, equatorial regions (similar to aging snowfields on Earth, just imagine the difference between walking on freshly fallen snow and snow that's been on the ground for a few days, though some of that is due to shrinking pore space between ice grains and diurnal freeze/thaw cycles). At mid-latitudes, frost grains are cooler, and don't anneal to the degree they do at the equator.

Overall, an interesting paper that was quite easy to follow, despite being a spectroscopy paper ;) The authors hope to acquire additional observations of these regions to improve the signal-to-noise ratio of their maps.

Link: The global distribution of Sulfur Dioxide ice on Io, observed with OSIRIS on the W.M. Keck telescope [dx.doi.org]

Sunday, September 21, 2008

Galileo observations of volcanic plumes on Io

The last major paper on Io out of the Galileo mission was published in the October 2008 issue of the journal Icarus. "Galileo observations of volcanic plumes on Io," by USGS researcher Paul Geissler and NAU grad student Melissa McMillan, describes the observations acquired of Io's plumes during the entire Galileo mission. The abstract can be found at the link above, but the article itself is available to subscribers (individual or institution) only.

In this paper, the authors searched the Galileo SSI data set for volcanic plumes on Io, then used those images to determine particle sizes, column densities, and plume masses.

In all, the authors found plumes at 13 sites spread out across Io. These include optically bright dust plumes (like the one shown at left), faint dust plumes, and gas plumes, with the latter seen in eclipse observations by Galileo. In some cases, the authors found several of these types at a single volcanic center. For example, on I31 in August 2001, a Prometheus-type dust plume was observed at Thor, which was vigorously erupting at the time. A faint outer halo was also observed in the high phase angle images from that orbit. Pele-type plumes, large, faint plumes generated from gas emitted from lava fountains, went largely unseen by Galileo as SSI had poor sensitivity in the ultraviolet where these types of plumes are best seen. Pele's plume was observed on two occasions, during E4 and G29. Another Pele-type plume was also observed at Grian, resulting in a transient large plume deposit. Several Pele-type deposits were also observed, at Dazhbog and Tvashtar, while additional changes at Pele suggest that additional large plumes existed during the Galileo mission.

The authors then examined the visible-light spectrum of various dust plumes to determine the mean particle size and total plume mass. The authors determined that the small, optically-dense plumes seen at such volcanoes as Zamama, Pillan, and Prometheus consist of course-grained "ash" particles. Combined with the presence of a central dense column in these plumes, and the authors suggest that these particles erupt with the gas in the plume. Typical mass for these plumes was found to be around 106 to 107 kg. The authors also examined the faint outer halo at Thor. They found that the faintness of the plume is not because there is very little dust, but because they are made of much finer particles, 10 nm versus the 80-120 nm found in the brighter core of the plume. With particles that small, the plume would be more easily visible at ultraviolet wavelengths. Strangely enough, the faint outer halo has 10-100 times more mass than the inner, "dense" core. Keep in mind, as well, that even accounting for that inner core, the dust makes up only 10% of mass of these plumes, with the gas making up for the rest of it. The particles in the faint outer halo at Thor (and seen at Loki during the Voyager 1 flyby) are thought to condense directly from the gas in the plume, forming small, sulfur "snowflakes."

The authors also compared the observed plumes to the surface changes found by Galileo. They determined that the surfaces changes were caused by the dense, dust plumes, and not by the fainter gas/snowflake plumes, except in the case of the Pele-type plumes, which produce large, red rings. The deposits made by the gas plumes likely take the form of SO2 frost that is transparent at visible wavelengths. The mass of the plumes suggests that dust fallout makes up only a small fraction of the overall resurfacing on Io.

Link: Galileo observations of volcanic plumes on Io [dx.doi.org]

Friday, September 19, 2008

Icarus October 2008 Issue

The table of contents for the October 2008 issue of Icarus is now online. Included in this issue is "Galileo observations of volcanic plumes on Io" by Paul Geissler and Michelle McMillan. Geissler and McMillan describe the observations of Io's volcanic plumes as observed by Galileo, and look into the differences in appearance between the gas plumes observed in eclipse and the dust component observed in daylight. The paper was posted online in about four months, and yes, I still intend on doing a full post on that paper.

Link: Science Direct - Icarus, Volume 197, Issue 2, Pages 377-640 [www.sciencedirect.com]

Monday, March 24, 2008

S2O, polysulfuroxide and sulfur polymer on Io’s surface?

The other Io-related paper in the April 2008 issue of the journal Icarus is titled, "S2O, polysulfuroxide and sulfur polymer on Io’s surface?" and is written by Donia Baklouti, Bernard Schmitt, and Olivier Brissaud. Such research is important as the presence of condensed S2O is one explanation for the reddish deposits near some volcanoes.

In this paper, the authors performed laboratory experiments on S2O, a compound predicted to be among the gases expelled by volcanoes on Io but to date not observed. The authors synthesized the compound from gaseous SOCl2, then allowed the product to condense on a target in temperature and pressure conditions expected on Io. This experiment was preformed several times, with different temperature conditions applied to the sample, and with some having pure S2O in the initial gas and others with 2-10% S2O in a matrix of SO2, to match the expected gas composition at Io's volcanic vents. At various times, the authors then measured the visible and infrared spectra of the sample plate and compared their results to Galileo NIMS data of Io's surface.

In both gas samples, much of the S2O disproportionated into sulfur and SO2 before condensing on the sample plate. When the sample plate was at a temperature below 120K, the resulting condensation was often a mixture of SO2, sulfur, and a small amount of S2O. Above that temperature, SO2 can not condense or sublimates when the sample plate is heated above that temperature, leaving behind the sulfur and S2O. However, the S2O does not stick around for long as it polymerizes, forming longer chains of polysulfuroxides until the molecules lose more and more of their oxygen and yellow sulfur polymers are formed as the temperature is raised more. These results suggest that on Ionian surfaces below 120K, the appearance of S2O would be masked by the presence of SO2, forming whitish deposits, and sulfur polymers, while above that temperature S2O is converted into yellowish polysulfuroxides. These results further suggest that S2O can not explain the reddish deposits seen at some volcanoes. This further supports the idea that these deposits are formed from the condensation of S3 and S4 that is directly vented from Io's interior.

The authors compared their visible and infrared spectra measurements to Galileo NIMS spectra of Io. The authors found that many S2O absorption bands either occur on the wings of strong SO2 bands, which dominate Io's infrared spectrum, or are too shallow or would occur over too small a surface area to be observed by NIMS. The NIMS spectra is better explained by a combination of SO2, stable S8, and sulfur polymers.

Link: S2O, polysulfuroxide and sulfur polymer on Io’s surface? [dx.doi.org]

Sunday, March 23, 2008

Transfer of mass from Io to Europa and beyond due to cometary impacts

Yesterday I posted that the new issue of the journal Icarus is now online. Two papers in the issue are directly related to Io. The first is titled, "Transfer of mass from Io to Europa and beyond due to cometary impacts," by José Luis Alvarellos, Kevin J. Zahnle, Anthony R. Dobrovolskis and Patrick Hamill. In this paper, the authors describe their modeling of ejecta from impacts onto the surface of Io, determining where that ejecta eventually end up in the Jovian system, and calculating how much mass is transferred from Io to the other major satellites in the system.

They modeled the ejection process two different ways. First, they assumed the surface of Io is a regolith and an impact will fling pre-existing blocks or rubble out from the crater. Second, they used a model by Jay Melosh et al. (1986), where the impact ejects chunks known as spalls out from a more competent or hard rock target. Based on what is known of Io's surface, where volcanic resurfacing occurs at a faster rate than impact gardening, the authors state that the latter model is likely more applicable.

The authors simulated impacts at
the apex (center of the leading hemisphere), the antapex (the center of the trailing hemisphere), the sub-jovian point, the anti-jovian point, and the south pole. From the two models described above, the authors were able to calculate the velocities of particles generated by the impact as well as how much ejecta is generated by the impact of a generic 1.5 km wide Jupiter-family comet. Finally, 600 test particles with velocities fast enough to escape Io's Hill Sphere were injected into a model of the Jovian system to see where these particles would end up after an integration of 10,000 years.

The authors determined that the vast majority of the ejecta would wind up reimpacting Io, 93% in the rubble model, 86% in the spall model. This is expected since the particles start out in Io-crossing orbits. Their simulations found that between 5% ("Rubble" model) and 9% ("Spall" model) of the test particles end up impacting Europa, typically in a few decades to a couple of centuries. In the spall model, 4.6% of the test particles impacted Ganymede and less than one percent impacted Callisto. Only a handful in that same model ended up either impact Jupiter or one of the small inner satellites, entered heliocentric space, or survived the 10,000 year simulation. Typically, more ejecta reimpacted Io in the rubble model (where initial velocities are less so they start out in less eccentric orbits) than in the spall model, where their higher initial velocities put them in orbits that crossed that of the other Galileans.

Based on the percentage of material transferred from Io to one of the other satellites, estimates of the amount of ejecta per impact (typically 3x the mass of the impactor), and the impact rate on Io, the authors estimated the amount of mass transferred from Io to one of the other Galileans per million years. They estimate that approximately 3.1×10¹⁴ g and 1.6
×1014 g are transferred to Europa and Ganymede via impact ejecta every million years, making Io a significant source of minerals and nutrients to the surfaces of those moons. That's in addition to the mass transferred via sputtering.

Link: Transfer of mass from Io to Europa and beyond due to cometary impacts [dx.doi.org]