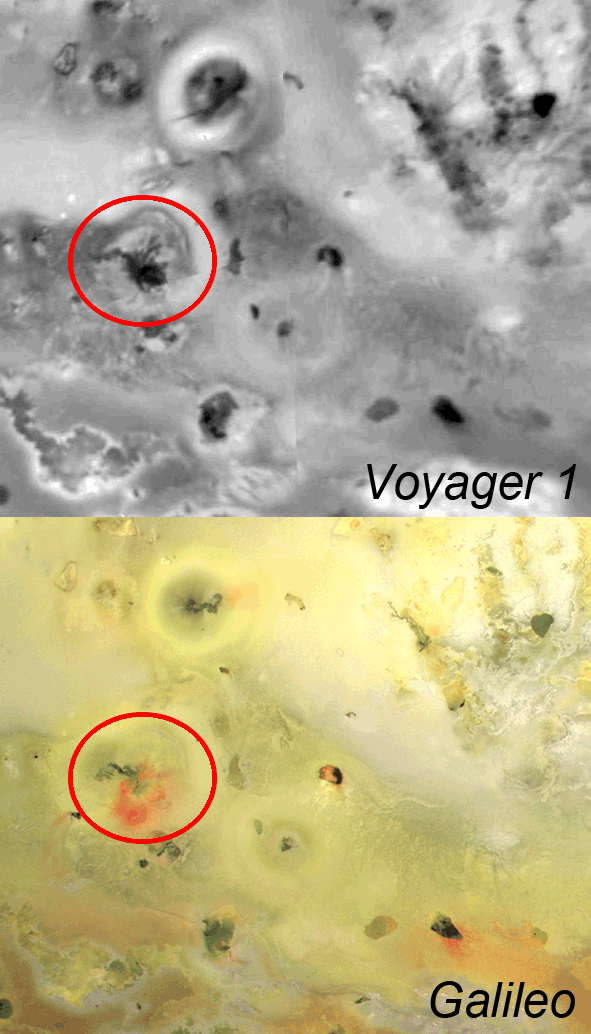
Each week here on the Gish Bar Times, we profile one of Io's 400 active volcanoes as part of our volcano of the week series. This week, we take a look at fairly dormant Shamshu Patera, a large patera, or volcanic depression, on Io's leading hemisphere. If you haven't read it already, be sure to check out last week's volcano of the week, Tvashtar, which we covered in great depth over three articles (Part One - Part Two - Part Three).
As always, let's take care of the basics first about this volcano. Shamshu Patera is located at 10.1° South Latitude, 63.0° West Longitude, or about 500 kilometers (310 miles) ESE of Hi'iaka Patera, a volcano of the week back in August. The volcano measures 115 kilometers (72 miles) north-to-south and 107 kilometers (67 miles) east-to-west. The height of the patera wall which marks the outer edge of the volcano is variable as the surrounding terrain is not constant, the result of debris flows coming off a mountain that abuts the northeastern margin of Shamshu Patera. Shadow measurements along the northwestern wall of Shamshu show that it is 500 meters (1,640 feet) tall, however the lack of a shadow along portions of its western wall suggest that it maybe less than 50 meters (160 feet) tall in some areas. Shamshu Patera was named at the IAU General Assembly in August 1997 after a pre-Islamic Arabian sun goddess.
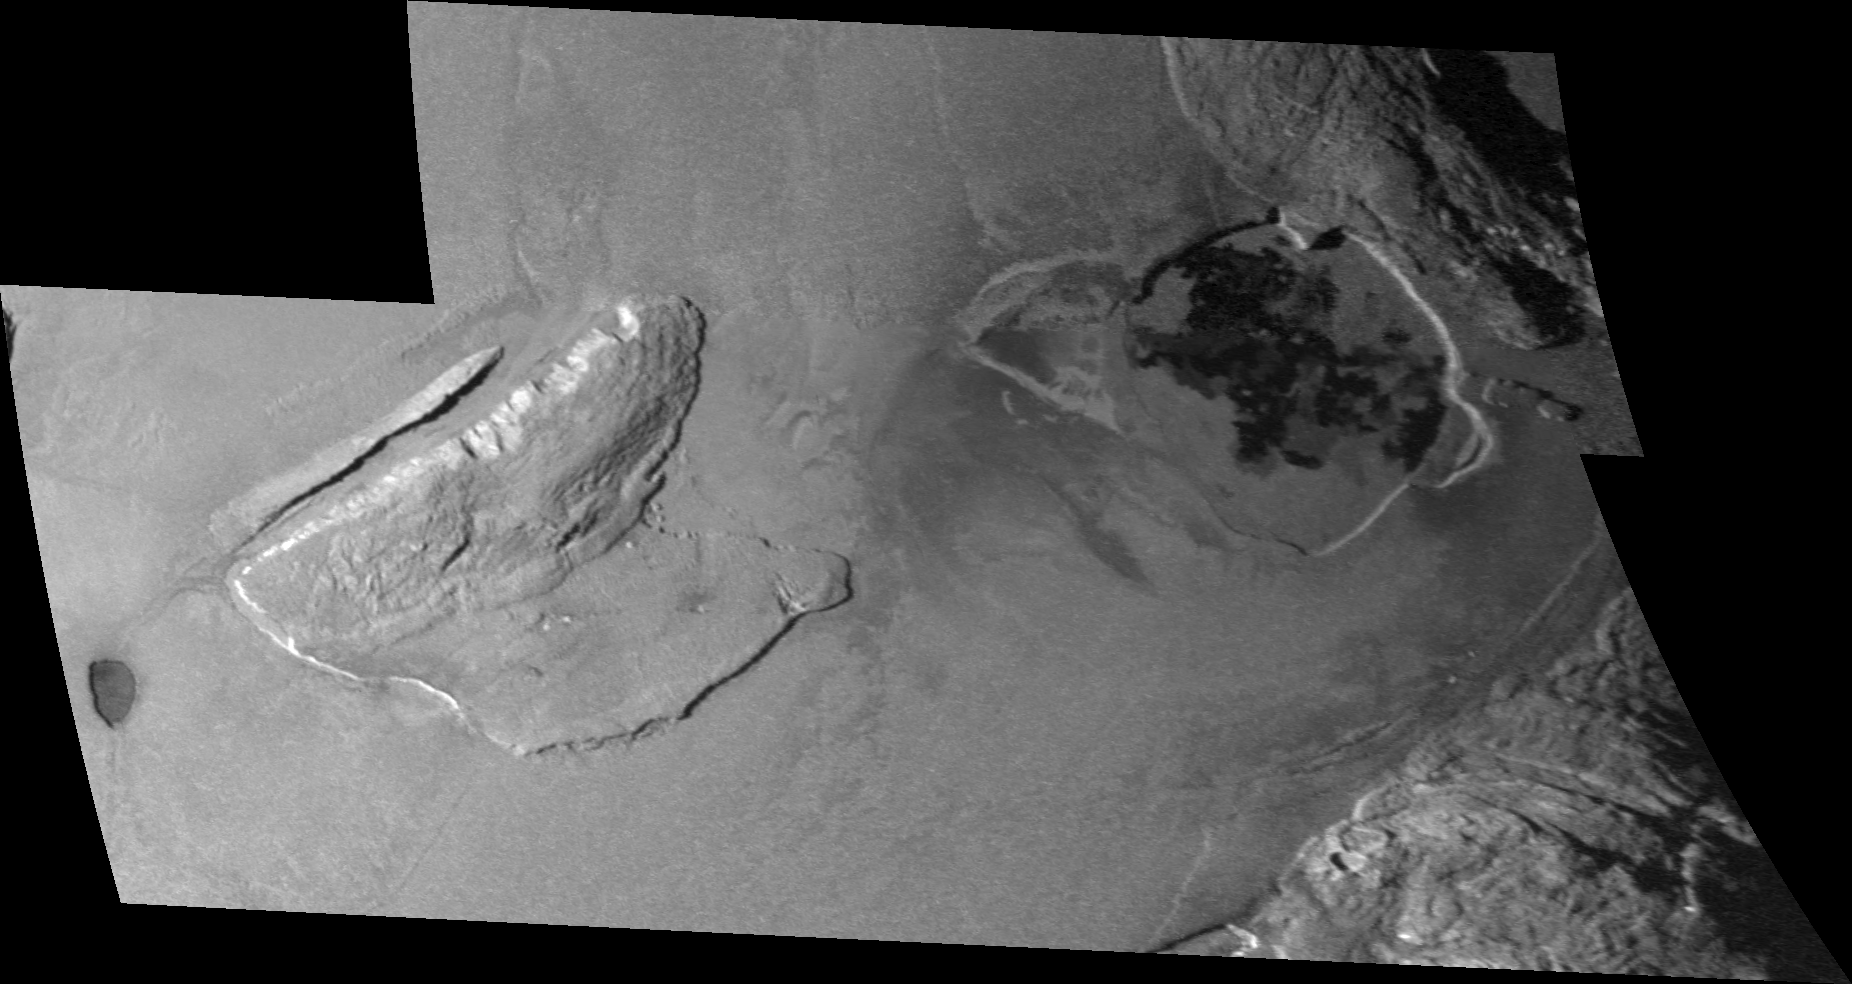
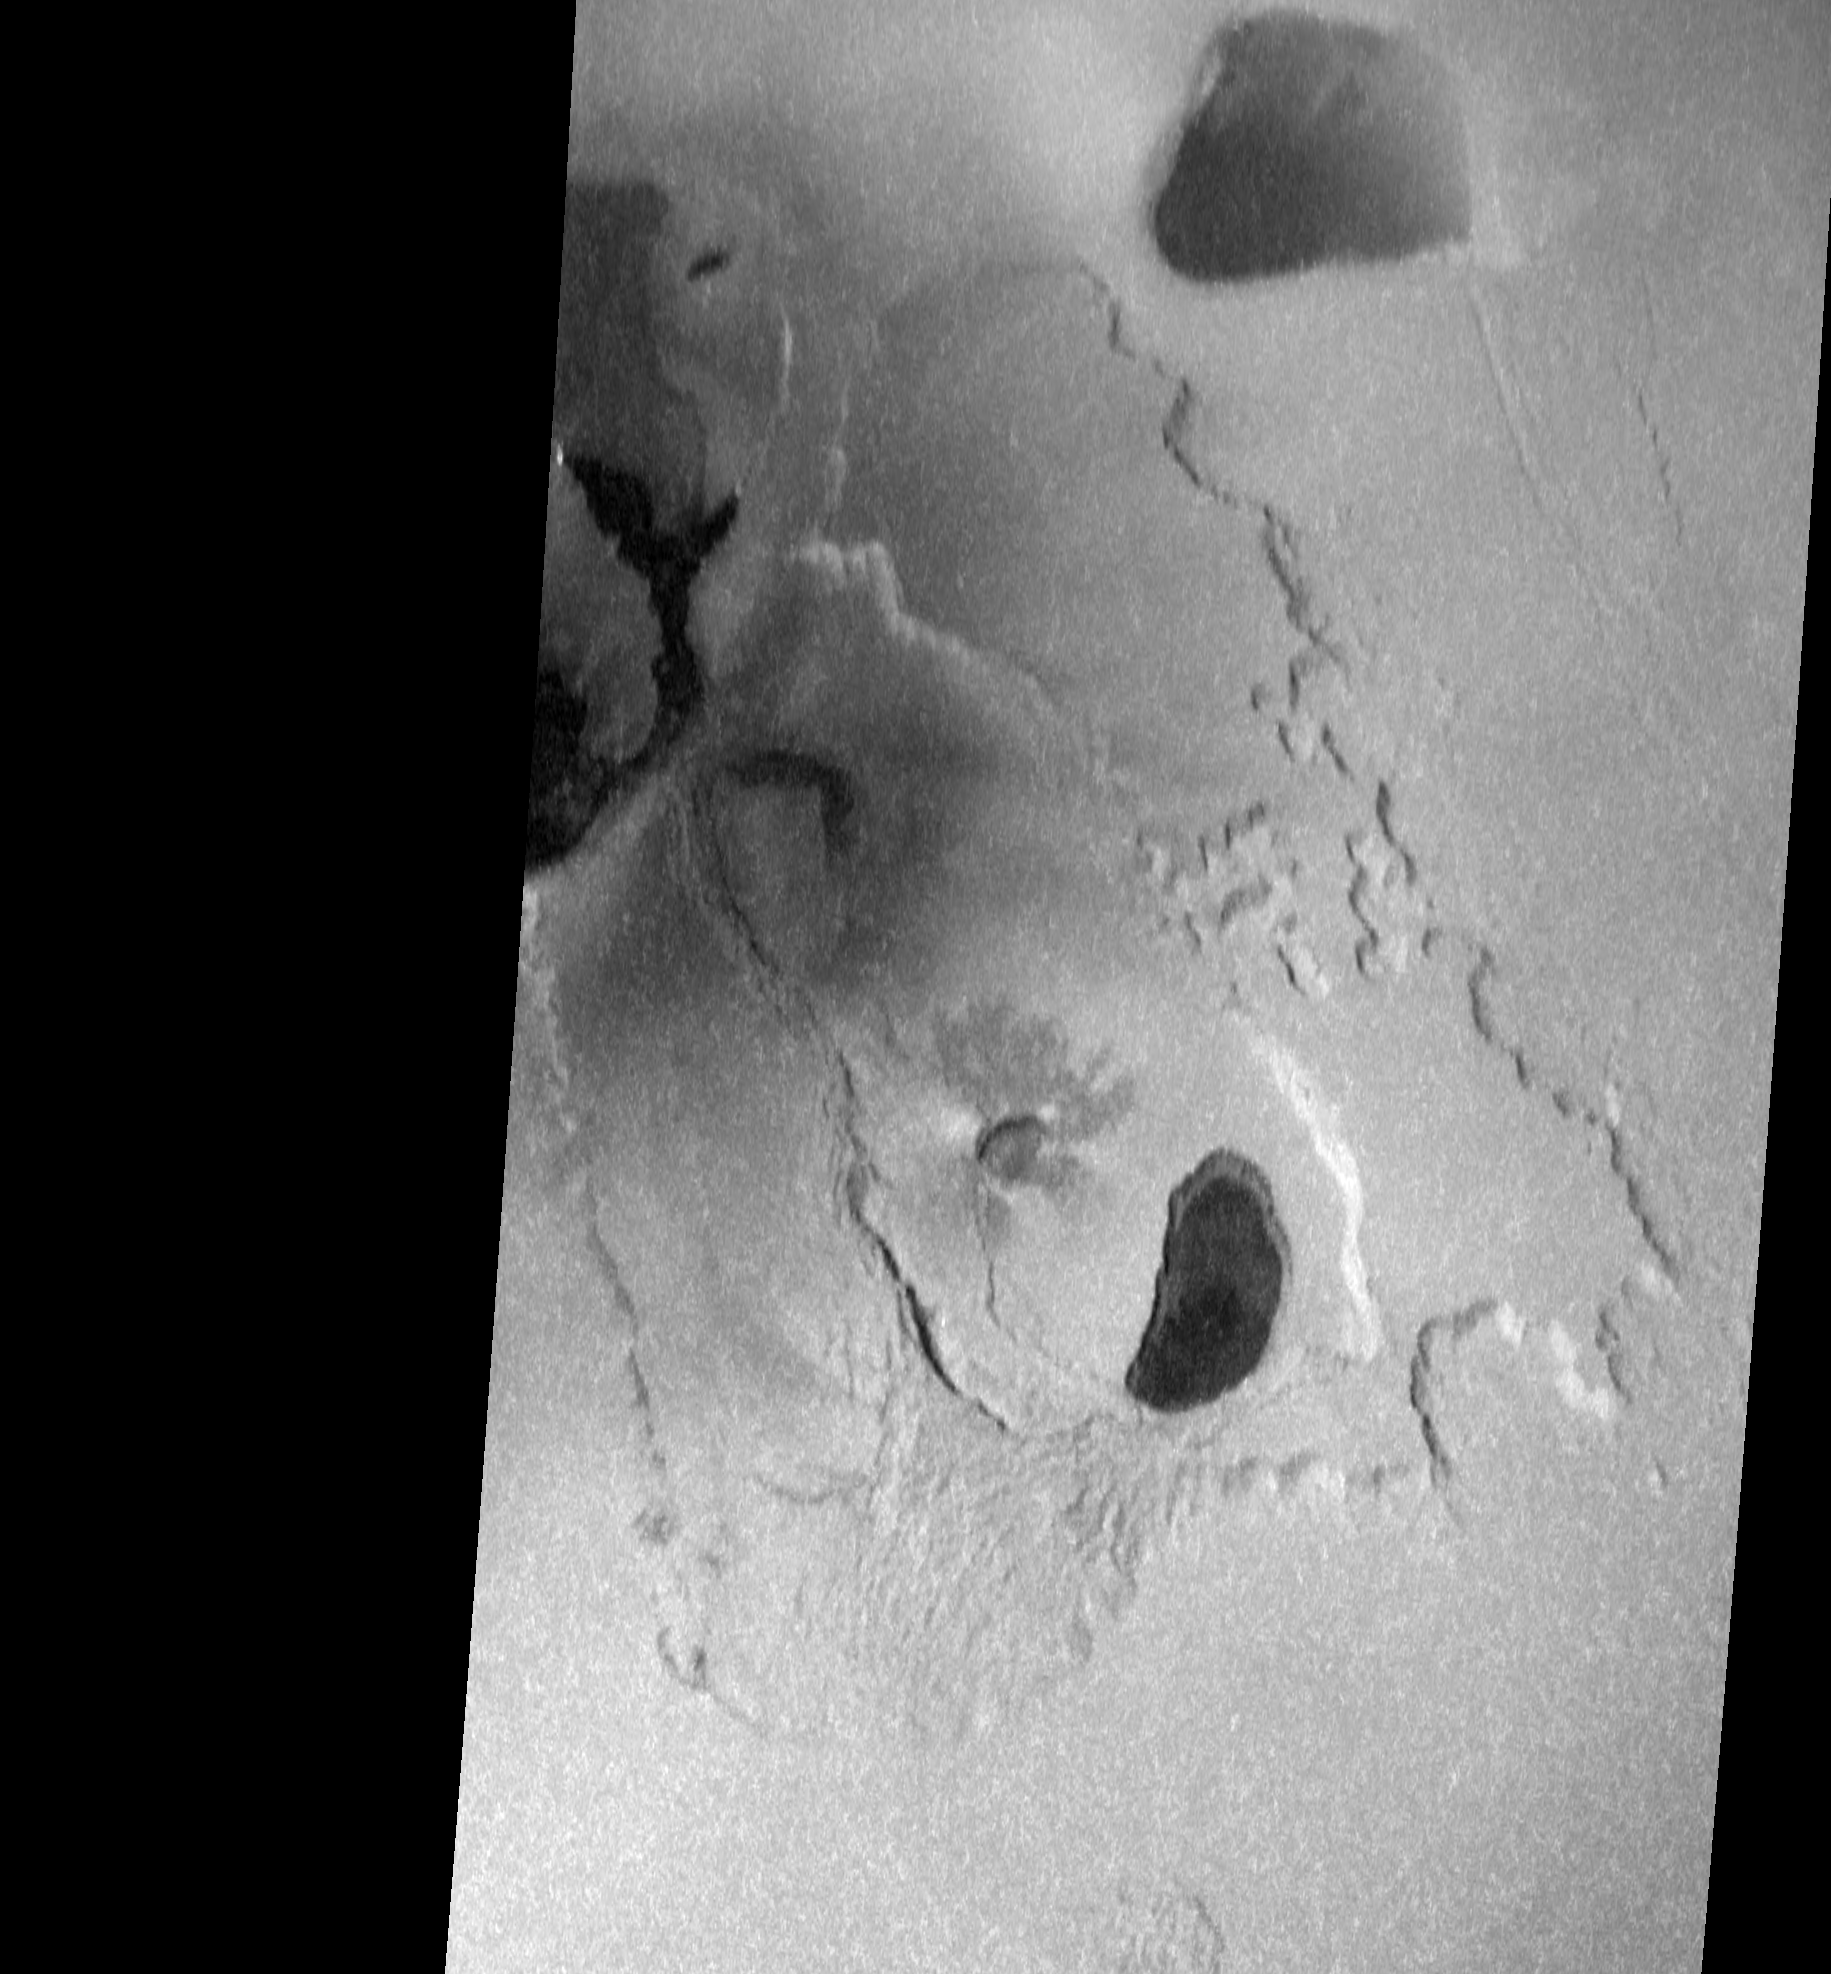
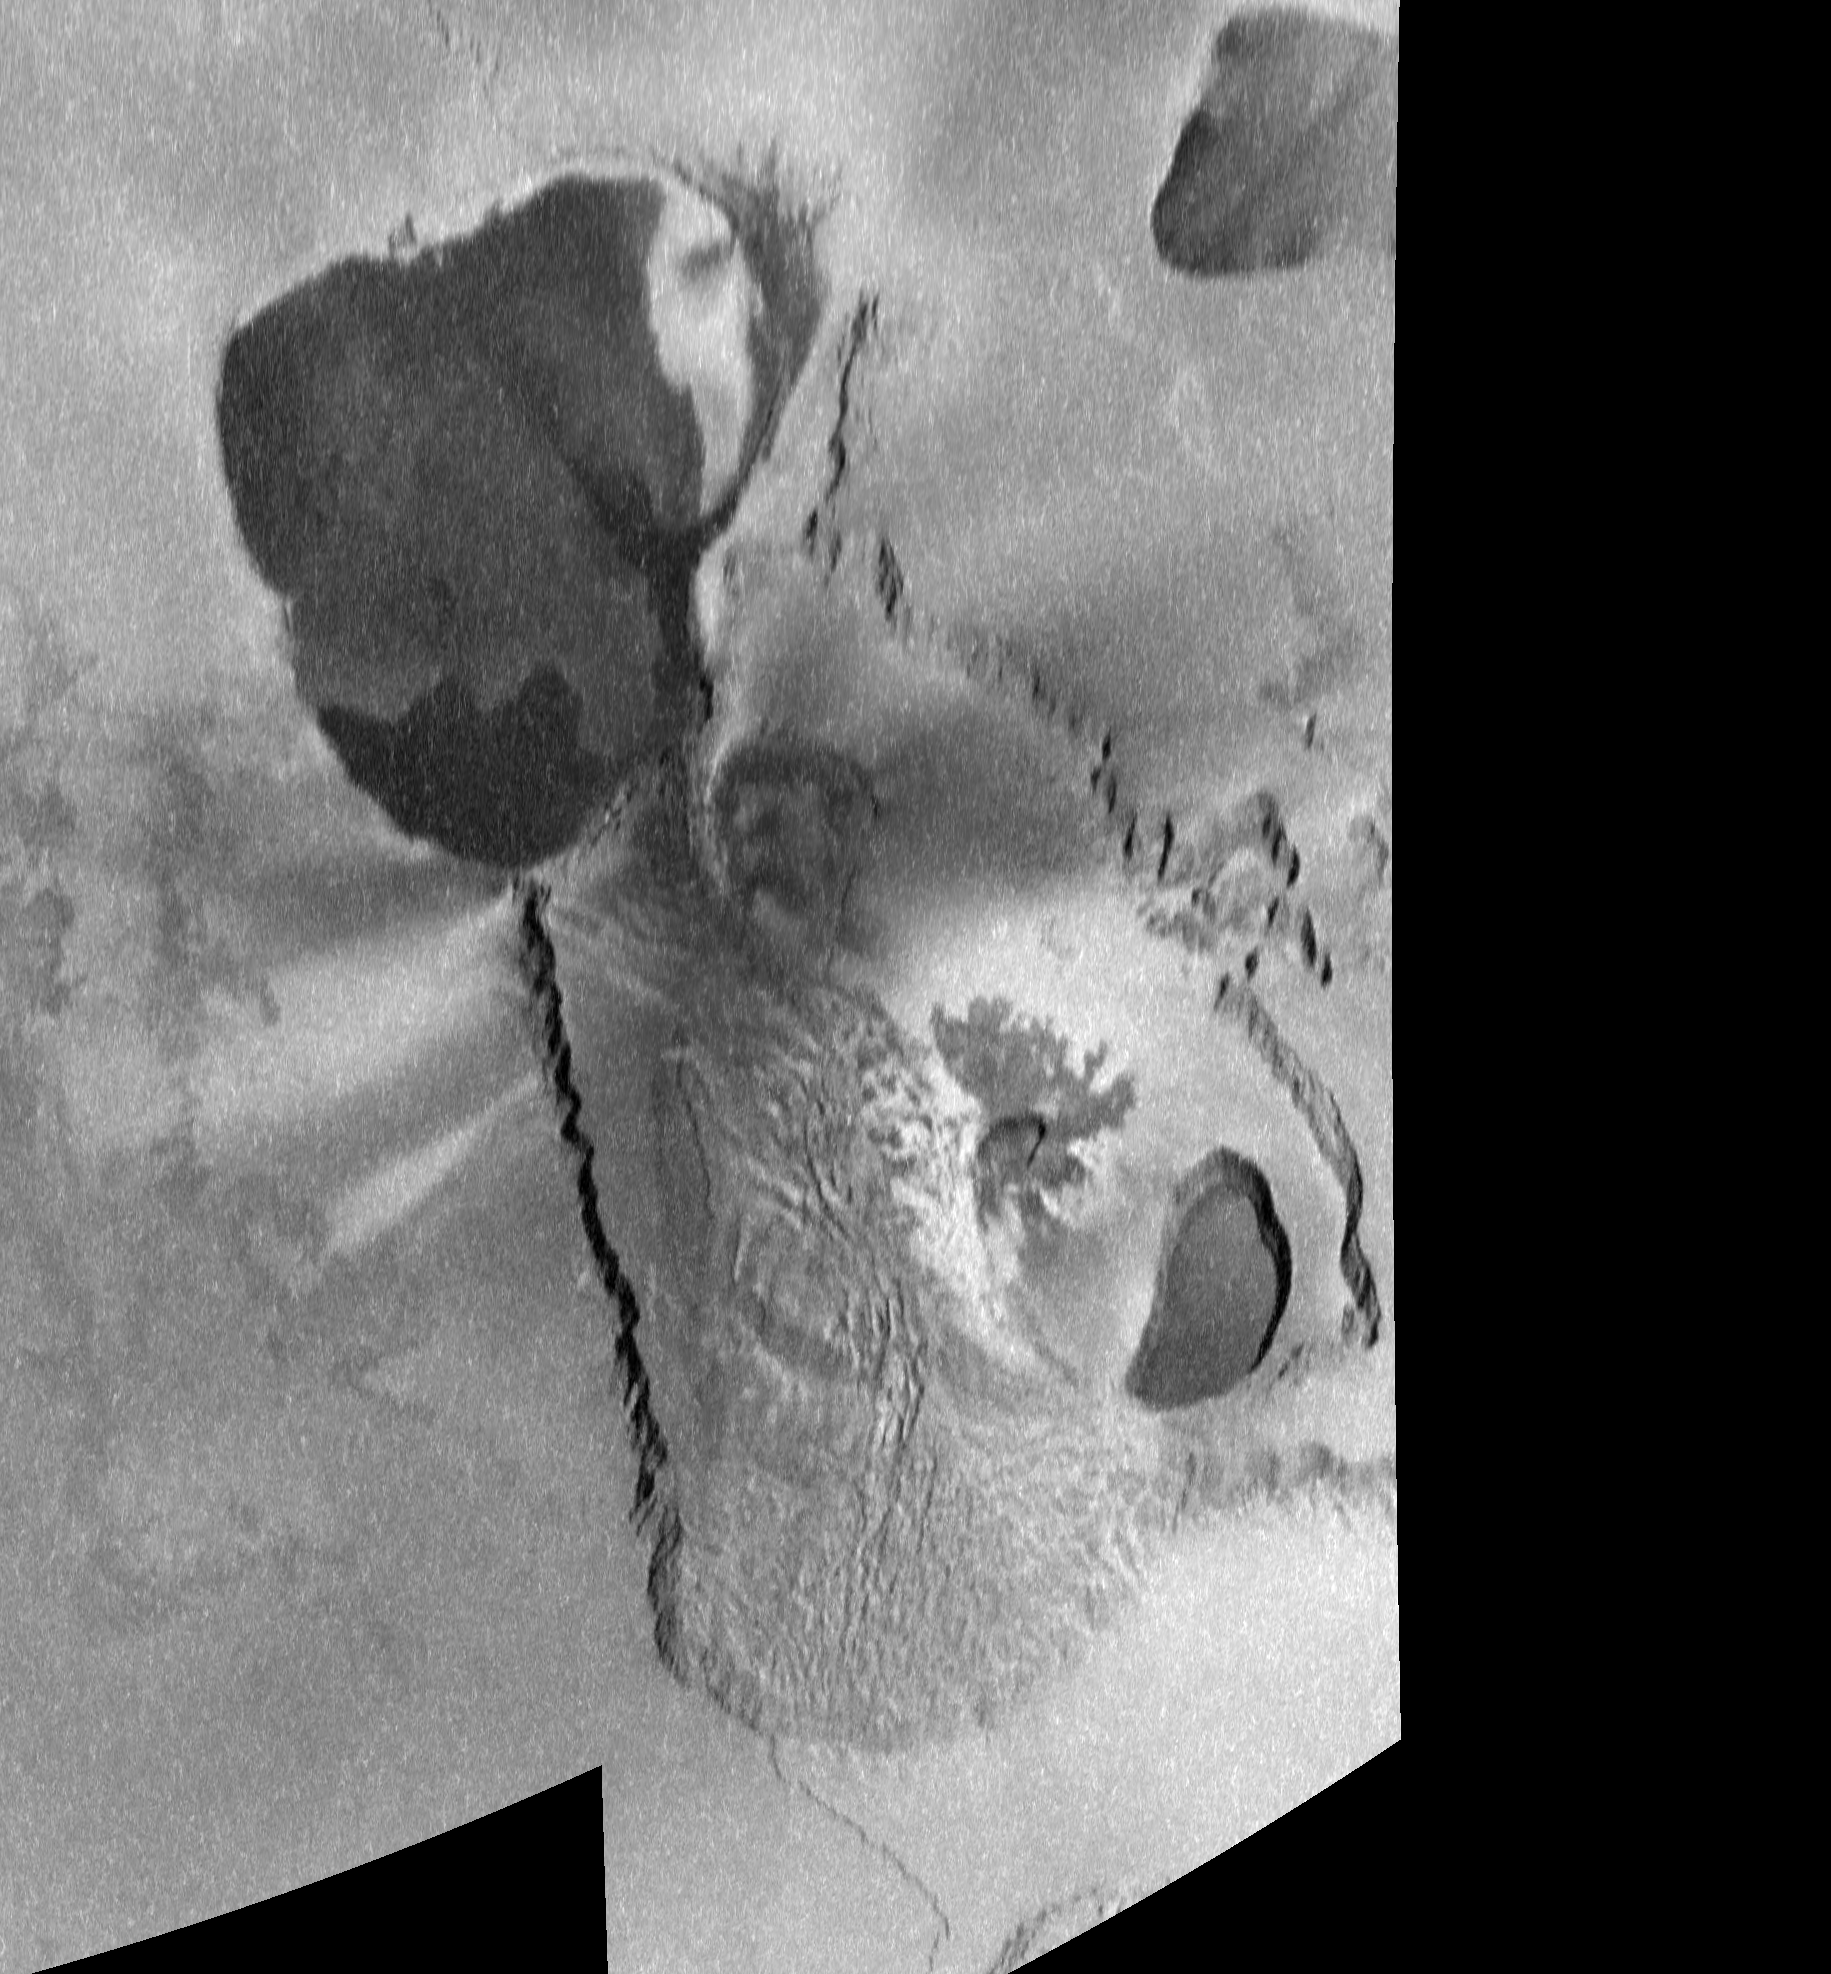
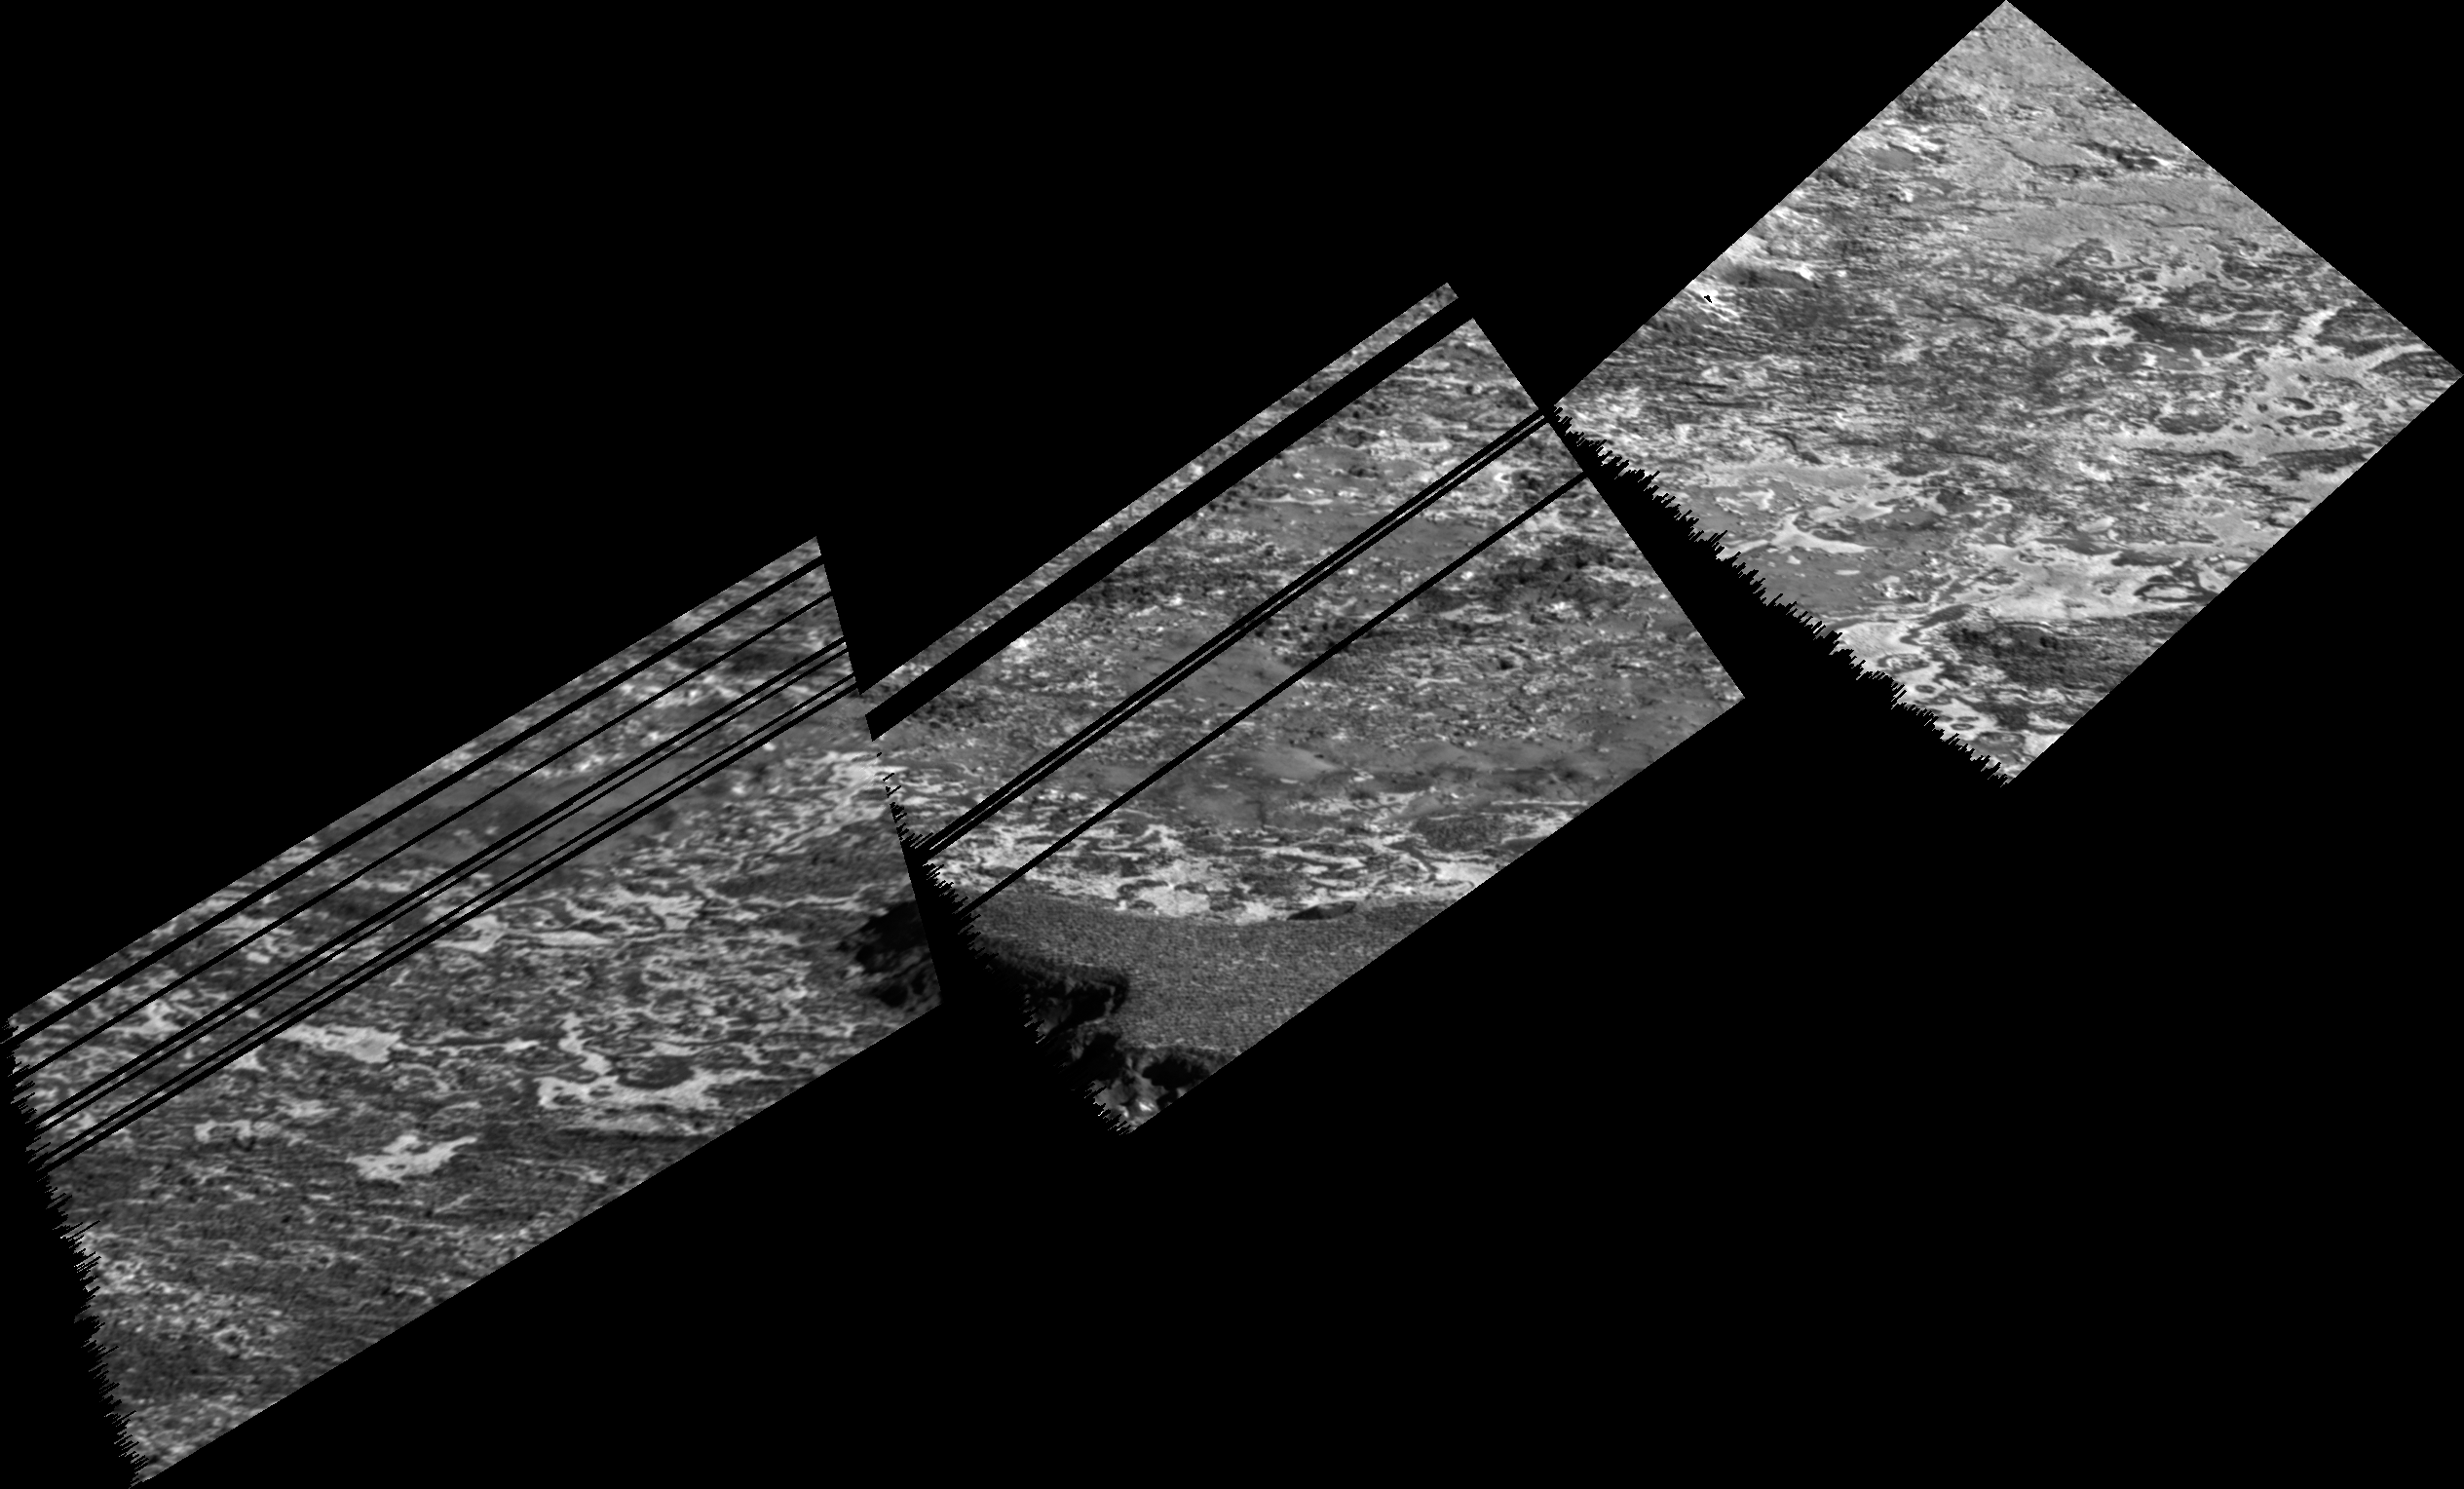
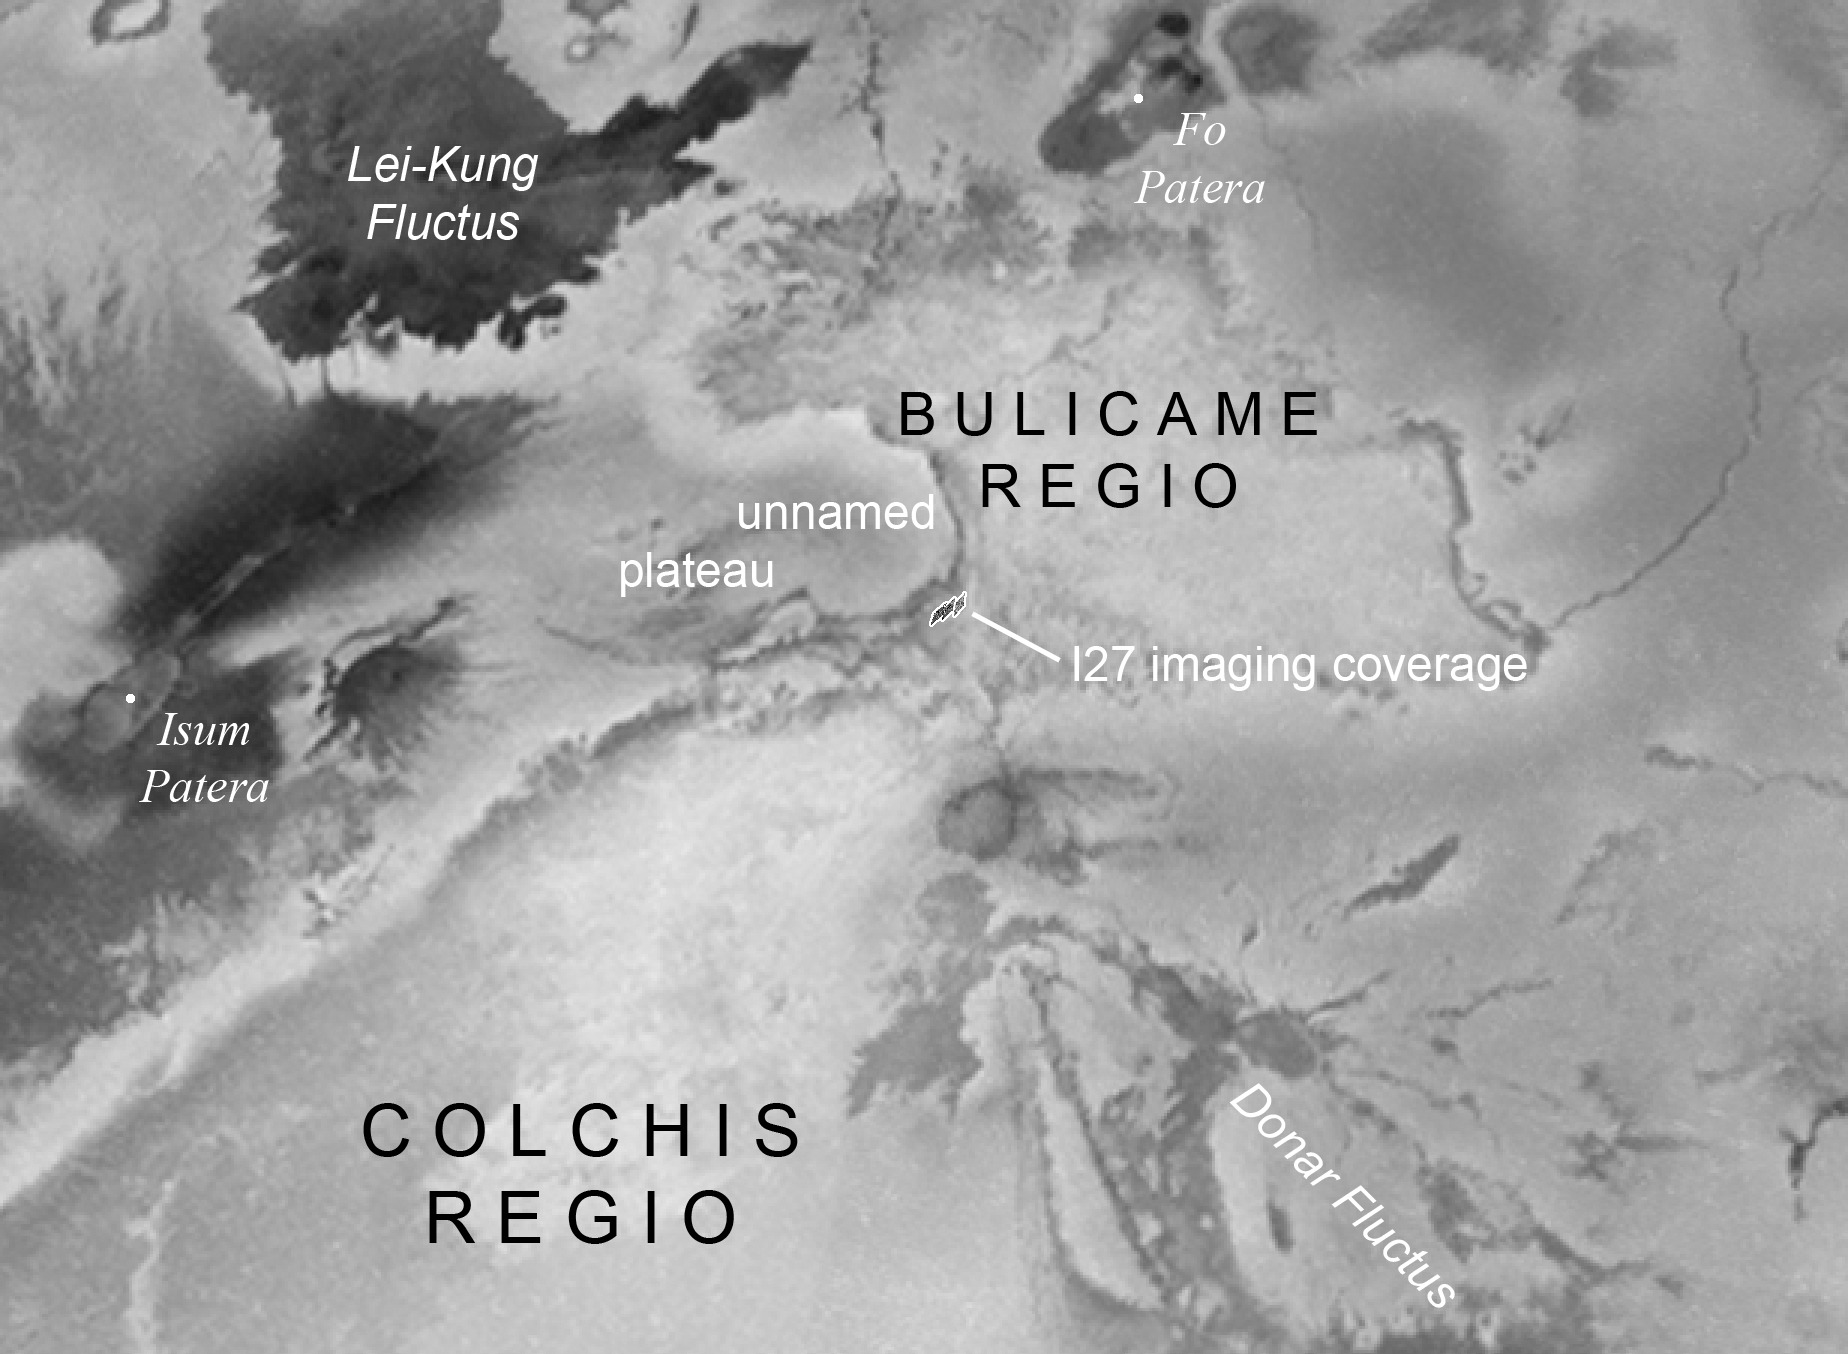
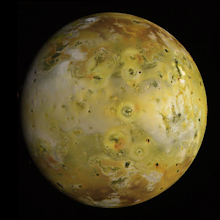
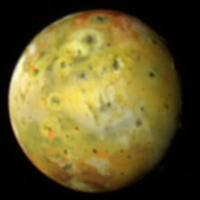
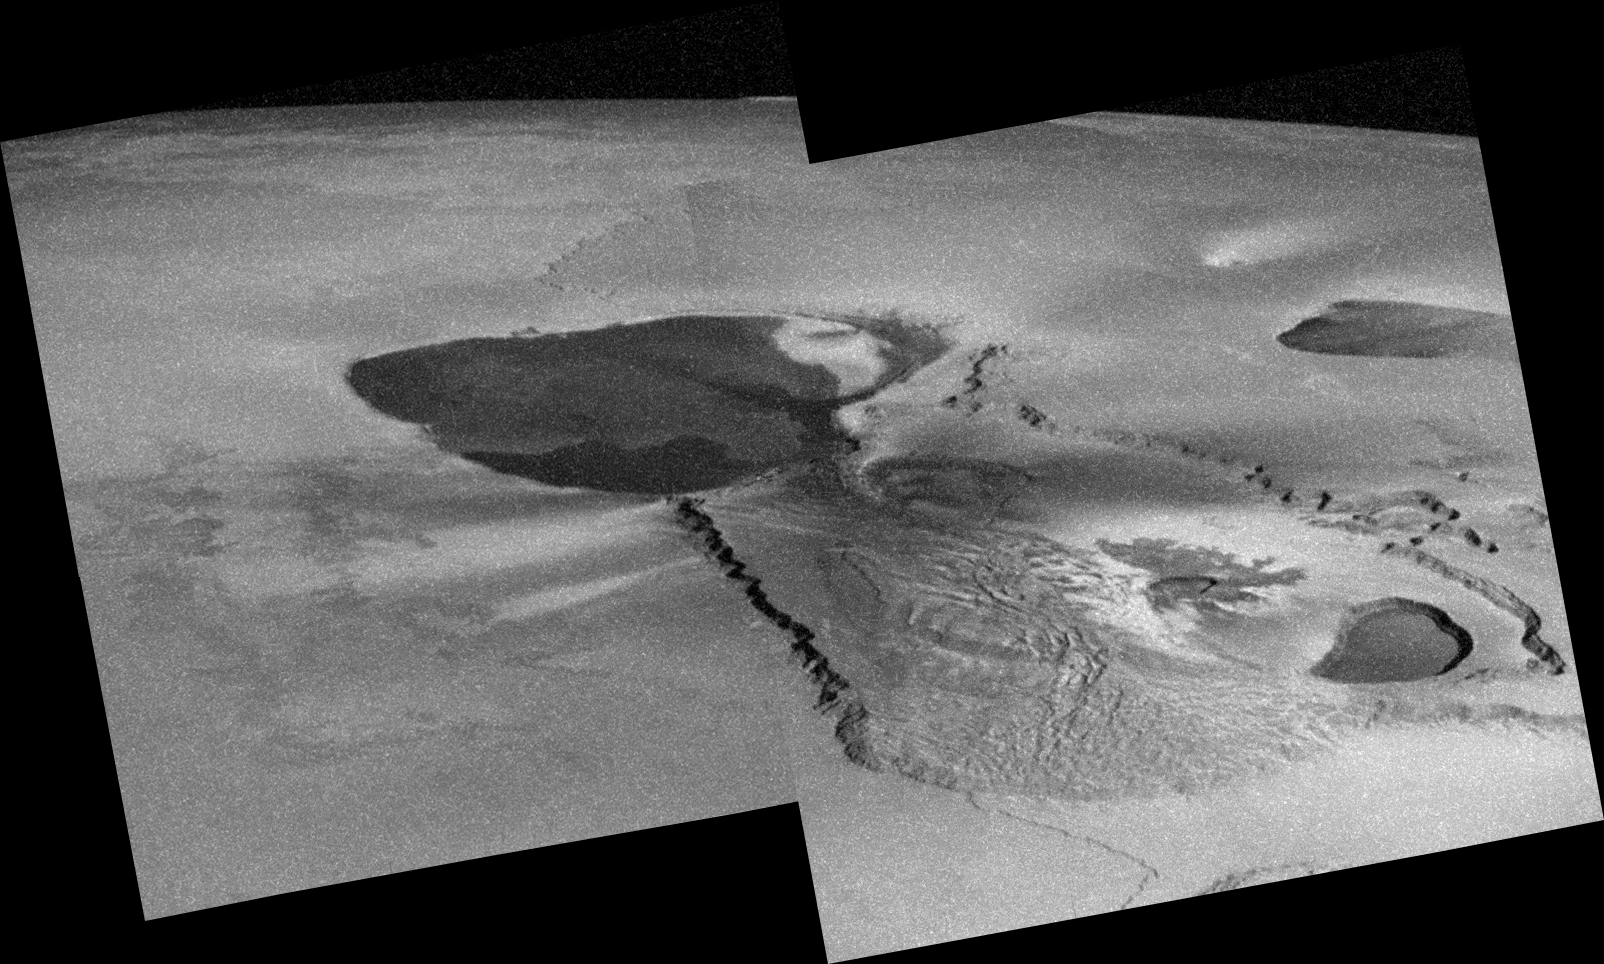
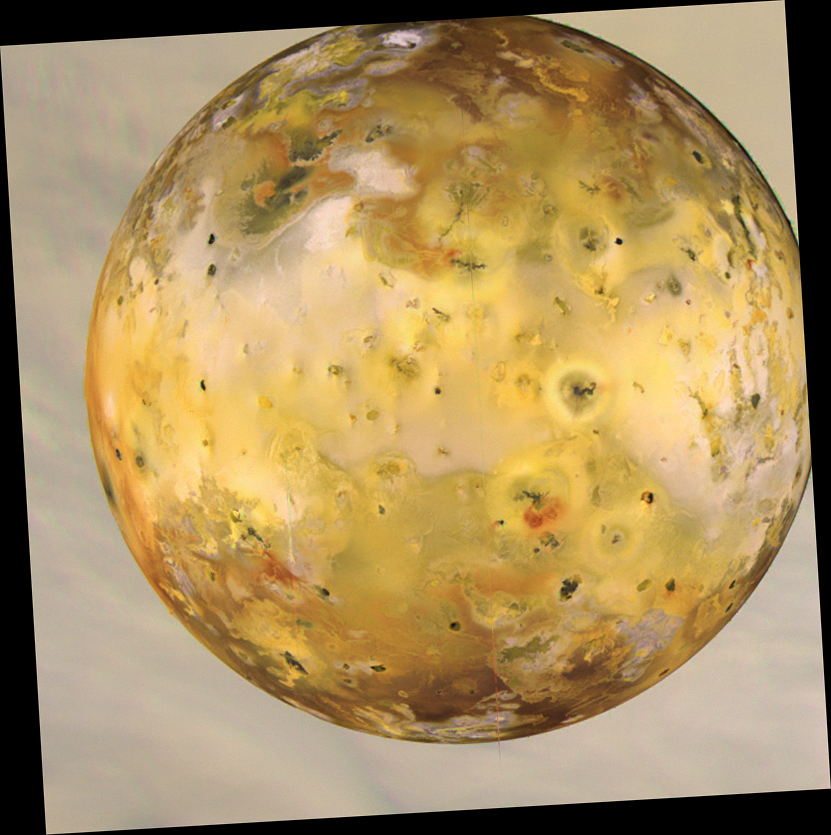
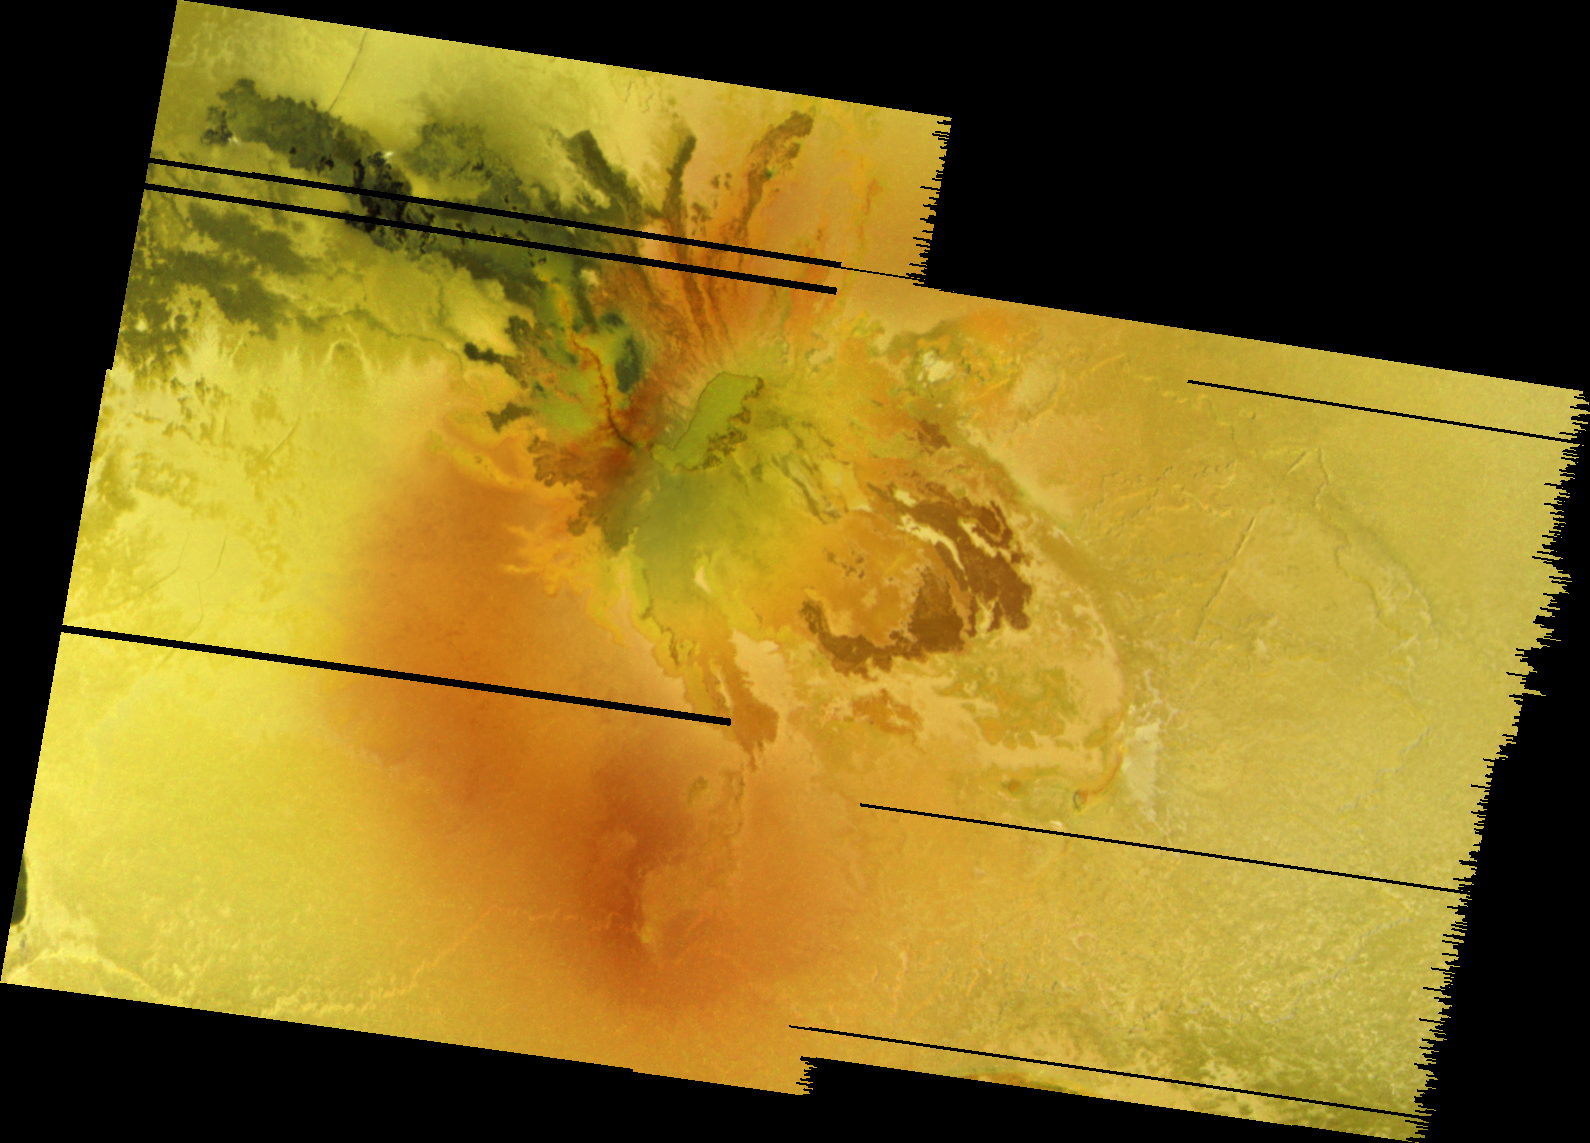
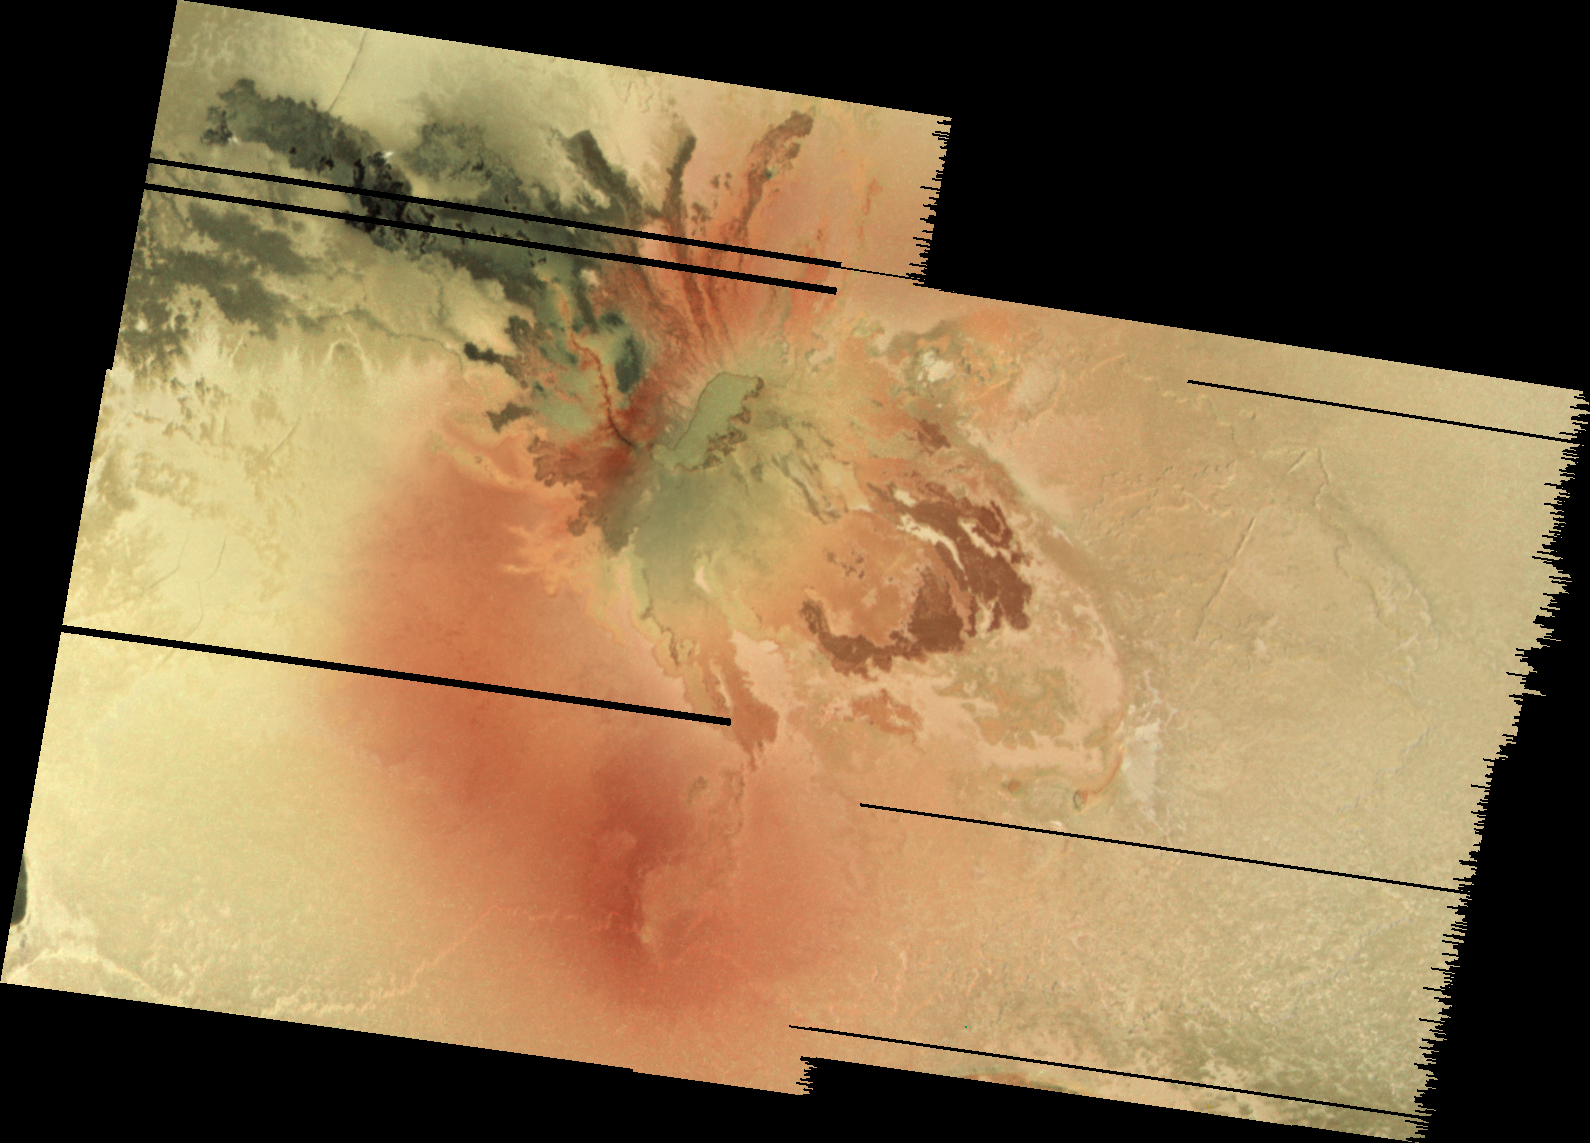
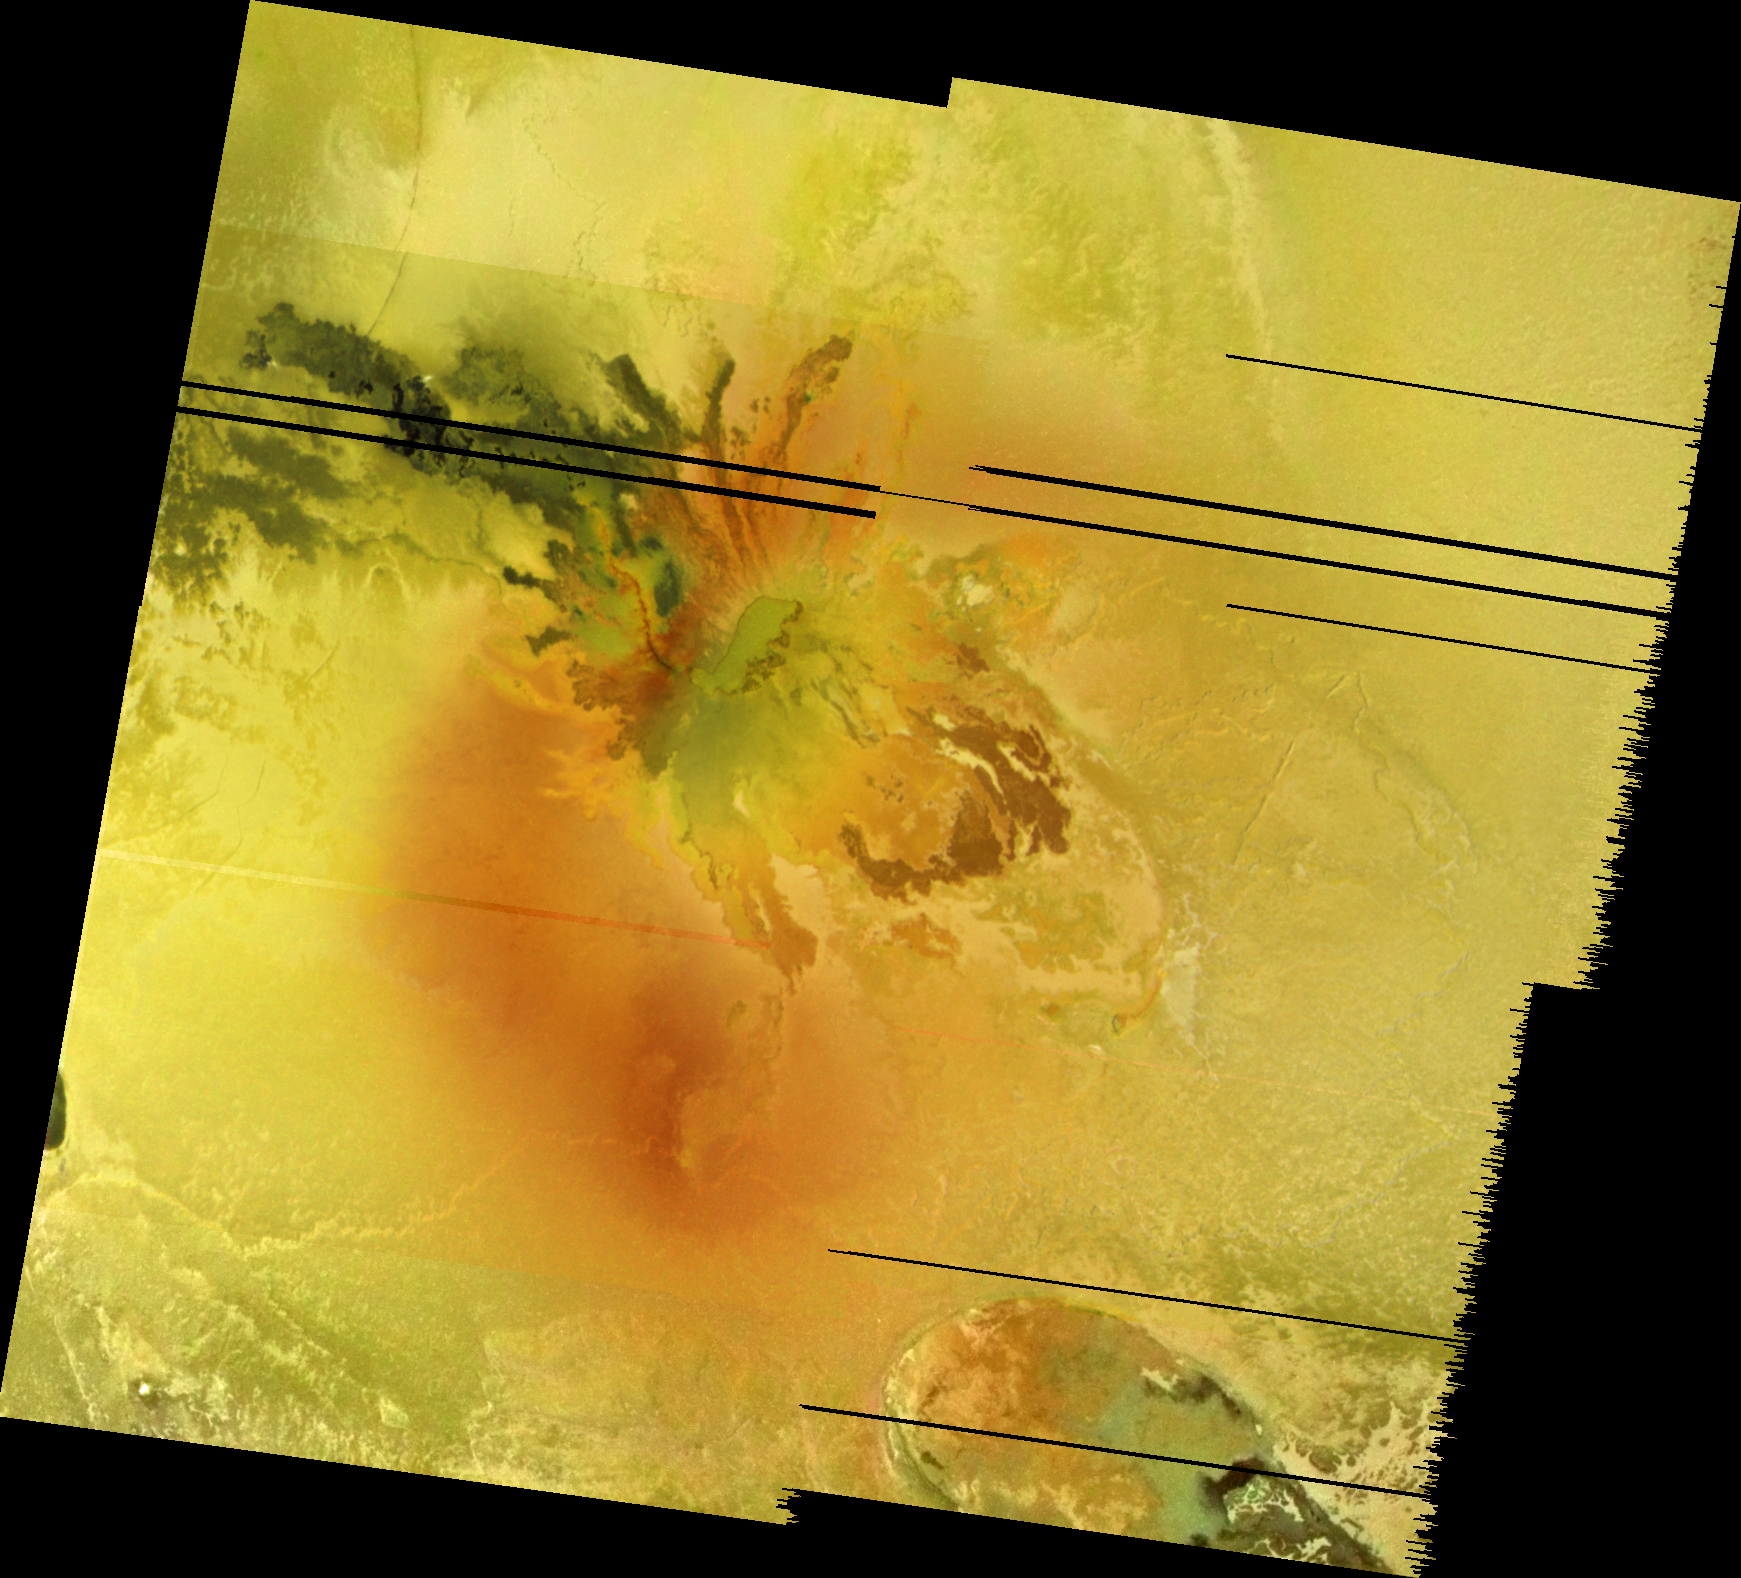
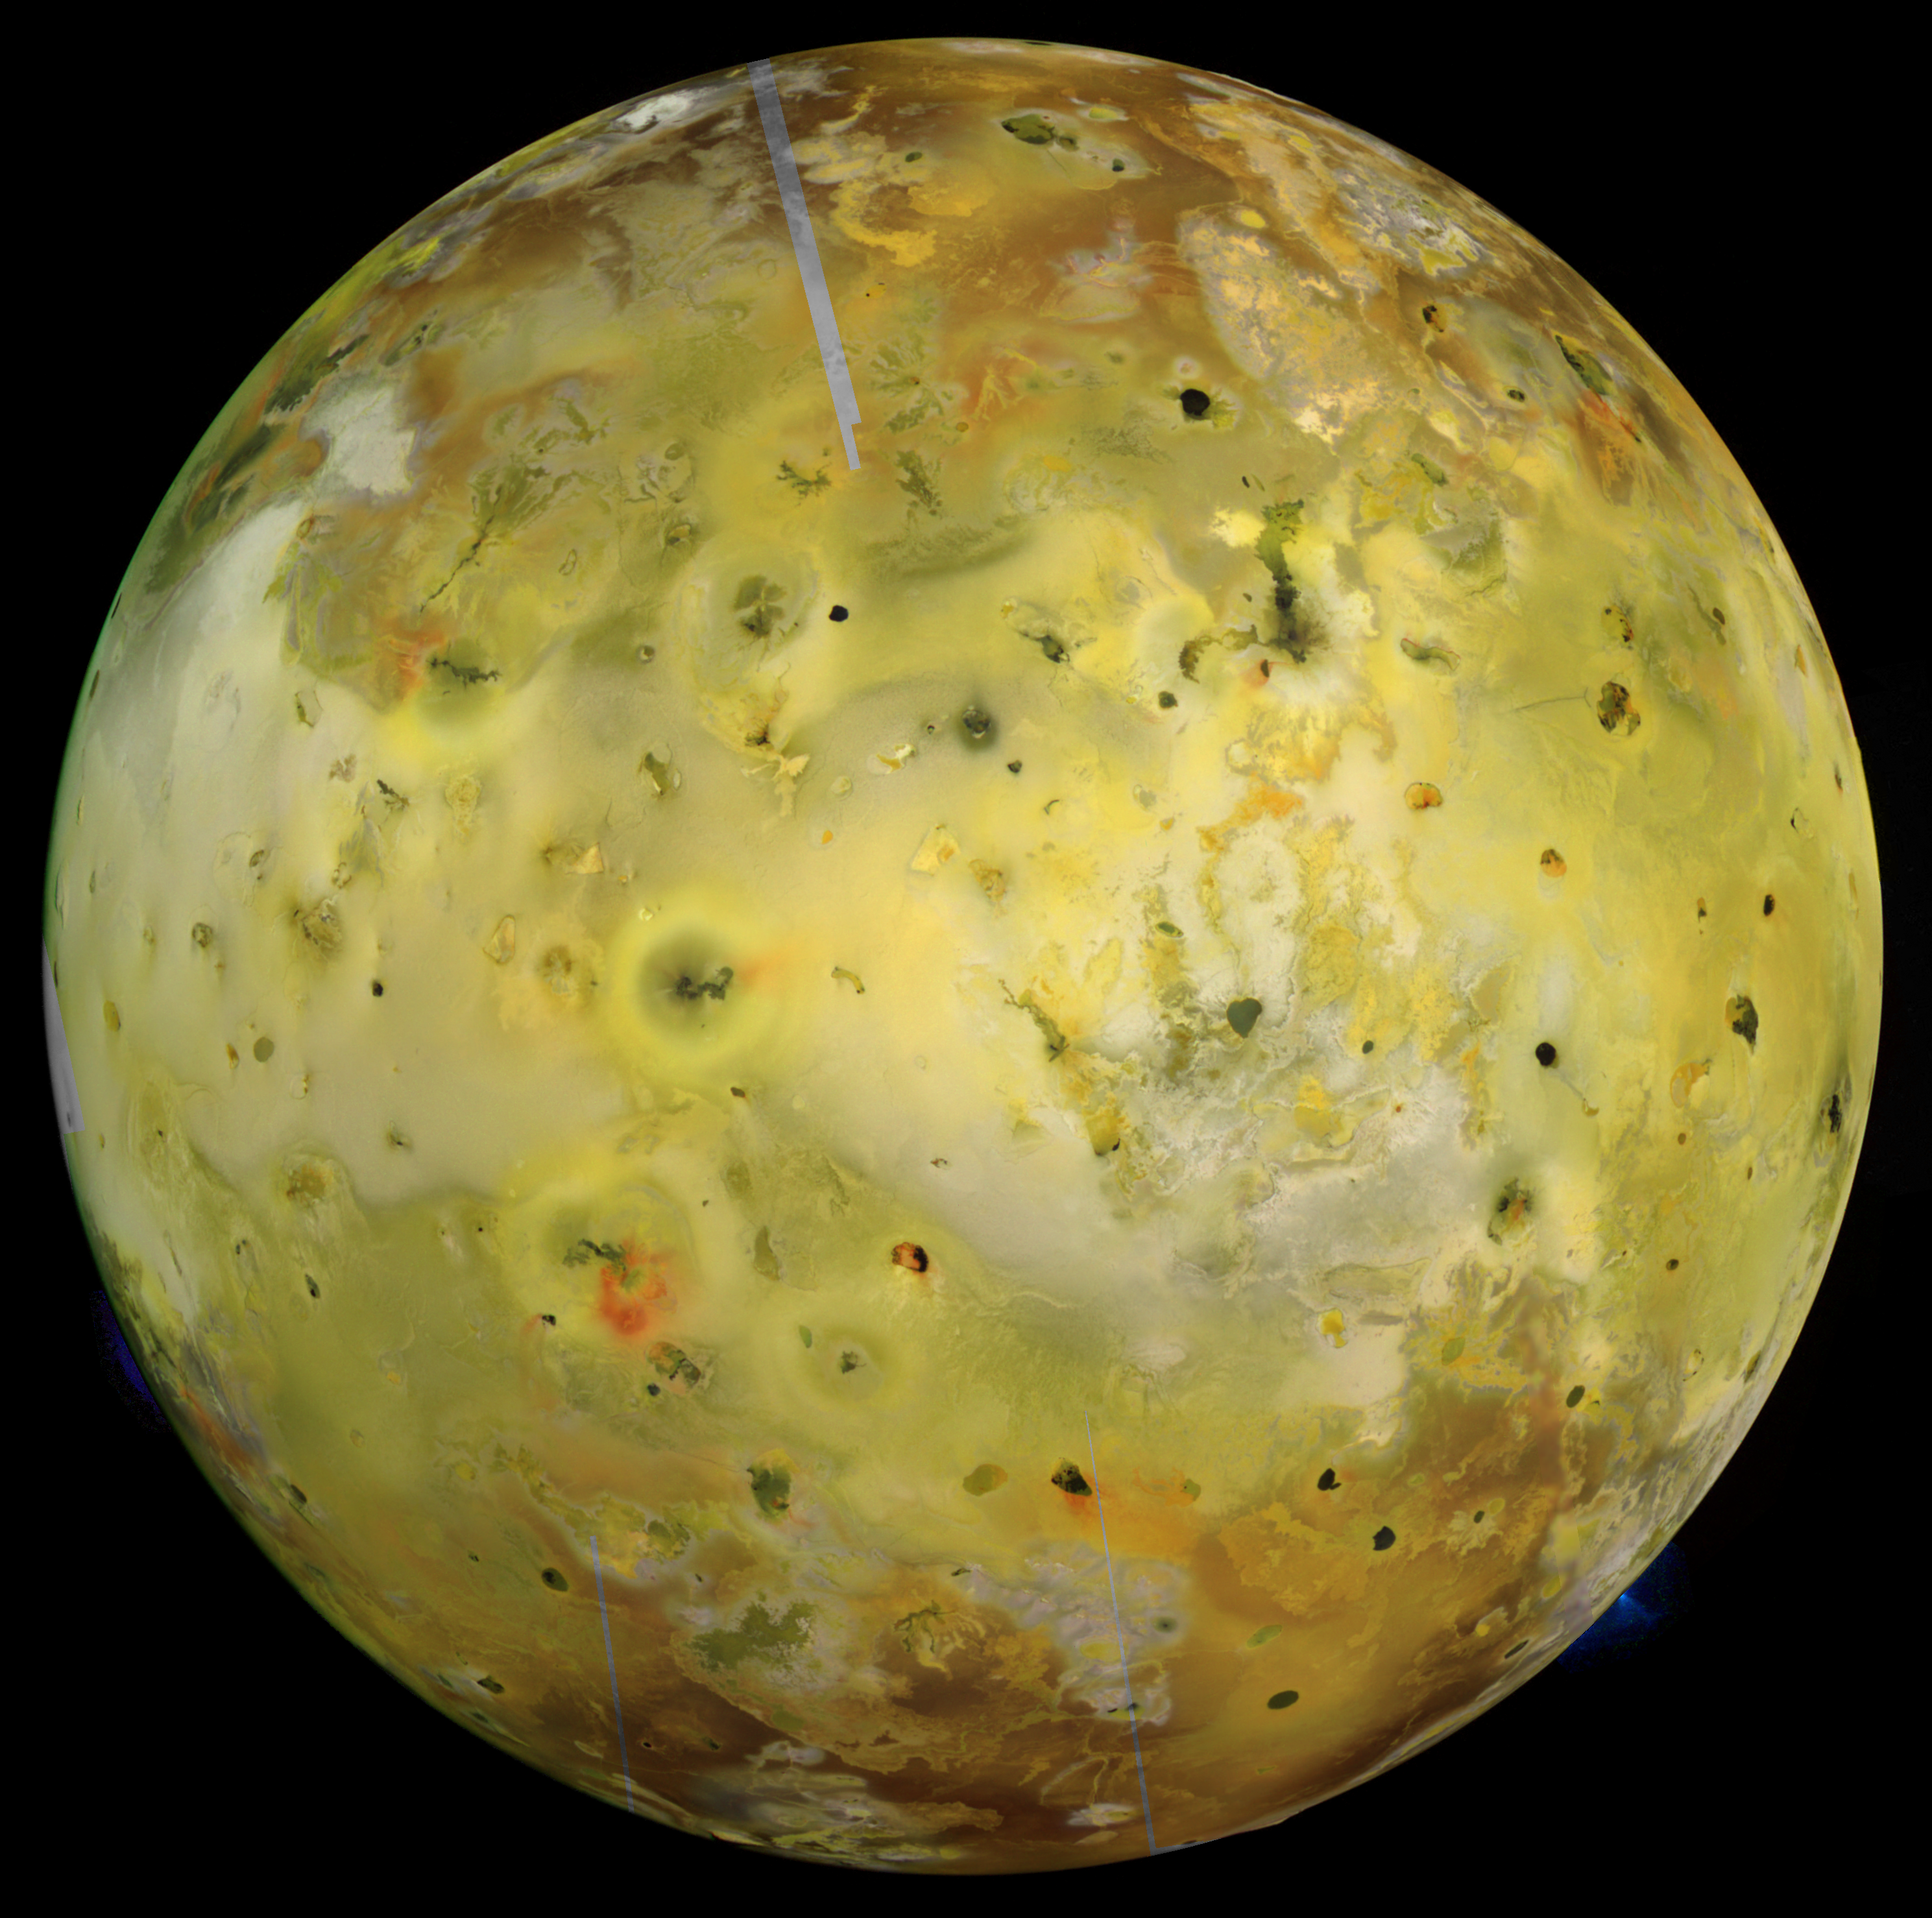
Galileo's best images of Shamshu were taken on February 22, 2000 during its I27 encounter with Io. I have reprojected the two images that covered Shamshu Patera into a two-frame mosaic, in a simple cylindrical projection with a scale of 350 meters (1,150 feet) per pixel. This mosaic covers all of Shamshu Patera, right of center, as well as Shamshu Mons to the west and portions of two other mountains: one abutting Shamshu Patera to its northeast and another a little farther away to the southeast. For a look of color in this region, see the map above as well as a global view from June 1997.
A few obvious features stand out about Shamshu Patera. The volcano's floor is dominated by dark lava flows of varying albedos. The different levels of brightness of its flows suggest that different eruptions produced new flow lobes that covered a different potion of its floor. As the lava flows age, they cool and all more sulfur dioxide and sulfur to condense on their surfaces. So as they age, the lava flows slowly brighten. Despite how dark many of these lava flow lobes look, I can't see any evidence for surface changes at Shamshu during the Galileo mission, so either very little SO2 is deposited here, or they maybe persistently active. More on that in a bit. The shape of Shamshu's dark material, and the more central location in the patera, is more consistent with these resulting from lava flows rather than this volcano being a lava lake, like Pele or Loki. About half of the patera of covered in material that has the same brightness as the surrounding Ionian plains and has a brighter orange color. These areas likely haven't seen lava flows in recent times (> 100 years) or may have been coated in sulfur.
Just outside of the Shamshu's walls, a number of apparent bright flows are visible. To the west of Shamshu, these bright deposits are correlated with the margins of the debris flow that came off the mountain to the northeast of the volcano. That's right, I said margins, because layers are apparent within the edge of the debris flow. The visibility of layers combined with the presence of bright material correlated with the scarps that mark the edge of these layers suggest that they are eroded by sulfur dioxide sapping. The presence of layers in the debris flow (if that's what this is) would also mean that the landslide materials are remarkably well sorted with a mix of basalt/sulfur and sulfur dioxide layers. A very bright flow is visible along the southern edge of Shamshu Patera, either the result of a sulfur flow, or, more likely, a silicate lava flow whose surface has been chemically altered. Something odd is going on here because this flow is quite bright, so bright that from distant imaging, it almost looks like it should be the southern margin of Shamshu Patera.
As far as current volcanic activity, Shamshu was observed by the Galileo Near-Infrared Mapping Spectrometer (NIMS) as an active hotspot on only one occasion, during orbit C10 in September 1997. The region was observed on several occasions before and since by Galileo and by New Horizons in 2007 and no additional activity was detected.
Next week, we will shift our focus from this fairly quiescent (at least in the present epoch) volcano to the more active Isum Patera on the opposite side of Io.
References:
Bunte, M.; et al. (2010). "Geologic mapping of the Hi’iaka and Shamshu regions of Io". Icarus 207: 868–886.
Showing posts with label Reprocessing. Show all posts
Monday, September 6, 2010
Wednesday, September 1, 2010
Io Volcano of the Week: Tvashtar - Part Three
Over the last few days, we have focused on the geology and volcanic history of Tvashtar Paterae, a string of four volcanoes located within Io's high northern latitudes. During the Galileo mission, Tvashtar was the site of several volcanic eruptions between November 1999 and October 2001, including a large, sulfur-rich plume that was seen by Cassini during its brief flyby in late December 2000. Since the end of the Galileo mission in 2003, monitoring of active volcanism on Io was limited to intermittent data taken at ground-based telescopes like the European Southern Observatory in Chile, Keck II, and IRTF in Hawaii. In addition, in late February 2007, the Pluto-bound New Horizons spacecraft flew by Io from a distance of 2.26 million kilometers (1.4 million miles), allowing the cameras on-board to search for surface changes on the moon since it was last seen five years earlier. Today, we will discuss the volcanic activity seen at Tvashtar since the end of the Galileo mission as what this volcanic history tells us about the variety of eruption styles exhibited by the volcanoes of Tvashtar and how their lavas are fed.
Don't forget to check out the previous two parts of our series on Tvashtar Paterae, if you haven't already done so! Part One - Part Two. This article is also part of our broader series where we examine one Ionian volcano each week.
The Tvashtari Reawakening
Throughout the 2000s, Io was imaged on numerous occasions using the adaptive optics system at the European Southern Observatory and Keck II telescopes. These two large telescopes use adaptive optics to partially correct for atmospheric effects on data acquired at these telescopes. Much of the data acquired of the Tvashtar region since of the end of the Galileo mission has been taken at the Keck II, 10-meter telescope at Mauna Kea in Hawaii. Other facilities have been used, of course, to monitor Io's active volcanism, but they often use techniques that only work for Io's Jupiter-facing hemisphere, on the other side of the moon from Tvashtar. After correcting for atmospheric effects, researchers using Keck II to observe Io can achieve a spatial resolution of 120 kilometers at near-infrared wavelengths. Unfortunately, because time on this one telescope is very limited, only a few nights each year were available to observe Io, and when you combine the possibility of inclement weather at Mauna Kea and the fact that Tvashtar wasn't always on the visible hemisphere, you can tell that there weren't many opportunities to observe Tvashtar. As far as I can tell from what has been published and what is online, between the [effective] end of the Galileo mission and the New Horizons flyby, the Keck group, which includes Franck Marchis, Imke de Pater, and Conor Laver, observed Tvashtar on: 12/22/2001, 12/26/2001, 03/08/2003, 05/29/2004, 04/17/2006, and 06/02/2006. Between at least December 2001 and May 2004, Tvashtar was not seen in Keck data. This suggests that it had become quiescent enough to not have any lava hot enough to produce detectable thermal emission.
However, the data from 2006 showed that Tvashtar had cut short its vacation and became more active. Intense thermal hotspots were observed at Tvashtar during observing runs on April 17 and June 2, 2006. The emitted power seen on June 2, the higher resolution of the two runs, was 7.7 ± 0.9 × 10¹² W, more than twice that seen at Pillan during its eruption in 1997, but still an order of magnitude less power than released at the most powerful volcanic eruption ever seen by humans, the Surt eruption in February 2001. Laver, de Pater, and Marchis published their data a year later, finding a blackbody temperature of 1240 K for June 2 data. This measurement was aided by the use of the then-new OSIRIS camera at Keck, which acquires high-spectral resolution data for each pixel, much like NIMS on Galileo, VIMS on Cassini, and CRISM on the Mars Reconnaissance Orbiter. Comparison between images like those at left with a Galileo/Voyager basemap revealed that the hotspot was centered at 59 ± 1 N, 121.5 ± 1W, placing Tvashtar C within the error box [see the map I posted yesterday for the letters used for the different volcanoes at Tvashtar]. The area covered by this basaltic lava was estimated at 57 km2 (14,100 acres), consistent with the size of Tvashtar C. However, given the size of the hotspot and the resolution of the available data, it is not impossible that it was located a bit farther to the north, at Tvashtar B (the site of the November 1999 and December 2000 outbursts).
Operation: New Horizons
A few months before Tvashtar re-awakened, the New Horizons spacecraft was launched from Cape Canaveral, bound for the then-most distant planet in the Solar System, Pluto. To get all the way out to that distant world in a timeframe that wasn't ridiculously long, the spacecraft was launched on the fastest trajectory of any interplanetary spacecraft, and even then it required a gravity assist at Jupiter to fine-tune its path and to boost its velocity to get out to Pluto in 2015. This gravity assist at Jupiter took place on February 28, 2007, providing an opportunity to test the spacecraft's instruments on the many worlds of the Jupiter system. More than 190 images were acquired during this encounter of Io by LORRI, a high-spatial resolution camera system with a single, broadband band pass. Additional data was taken by MVIC, a lower-spatial resolution, 5-filter camera that covers visible and near-infrared wavelengths, and LEISA, a near-infrared mapping spectrometer.
A couple of weeks before New Horizons made it closest approach to Jupiter and Io, John Spencer and Kandis Lea Jessup observed Io using WFPC2 on the Hubble Space Telescope. Images taken on February 14 and a week later on February 21 revealed a large plume over Tvashtar Paterae, not unlike the one seen by Cassini in December 2000. While the plume was only seen in ultraviolet filter images, it was hoped that the plume would still be visible at high angles in New Horizons images.
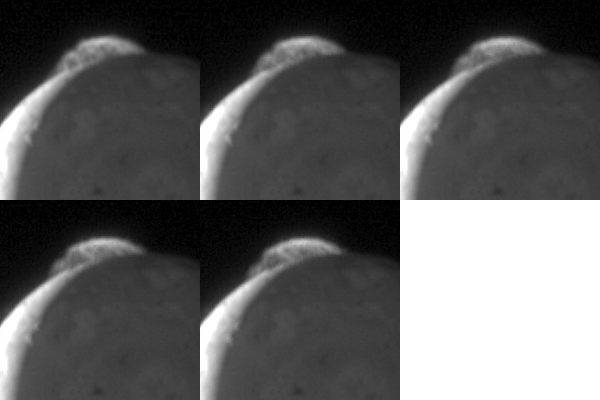
When New Horizons started imaging on February 24, 2007, it turned out to be even better than that. A large volcanic plume, 350 kilometers (220 miles) in height, was visible in early, low-phase angle images of Io. The near-polar position of Tvashtar also meant that the plume was visible in nearly every image taken by New Horizons. This data also revealed a new red ring deposit surrounding Tvashtar Paterae as a result of this plume. In one case, repeated imaging over the course of eight minutes allowed John Spencer and his group to track clumps within the plume as they descended from the crest of the plume to the surface. Their motions are consistent with sulfur and sulfur dioxide gas condensing at a shock front at the top of the plume (rather than dust particles rising with expanding gases, like at Prometheus), then descending as it flows down along the shock flow front. The clumps likely form from electrostatic forces either generated by the interaction of plume particles (doubtful considering the spacing between individual grains) or from electrons brought in by Jupiter's magnetic field or the flux tube that connects Jupiter and Io. The fact that the plume was so easily visible in LORRI and MVIC images suggests that plume contained more dust than other giant plumes like Pele's or the Tvashtar plume seen in 2000.
A thermal hot spot was also seen at Tvashtar by all three cameras on New Horizons (neglecting ALICE since it barely resolved Io). The high-resolution data acquired by LORRI (~10-20 kilometers per pixel) allows the eruption site to be determined, corresponding with the southern half of Tvashtar B. This was also the site of the December 2000 outburst that also produced a large volcanic plume and high thermal emission. Using the LEISA spectrometer, temperatures around 1250 K were found, though the detection of a hotspot in daylight images with the visible light LORRI would suggest that higher temperature components are likely as part of an active lava fountain or curtain.
Eruption styles
The volcanic eruptions seen at Tvashtar since 1999 suggests that certain volcanoes experience specific eruption styles. For example, Tvashtar B was the site of three, maybe four, large outburst eruptions over a period of a little over seven years. Each of these eruptions involved lava fountains that generated intense thermal emission, even at visible wavelengths. The 2006 eruption by itself generated about 7% of the total power output of all of Io's volcanoes put together. That eruption may have occurred at the small Tvashtar C patera instead, but no prior eruption had been seen there except for some faint thermal emission seen by NIMS in August 2001. Based on observations of the 1999 eruption, these eruptions don't last very long, less than three months, or transition from one type of eruption to another, as the lava fountaining phase transitions to open lava channels flowing out across the surface, and later to one dominated by insulated flows where lava is transported through lava tubes, limiting the visibility of hot lava to remote sensing. Dark diffuse deposits surrounding Tvashtar B show these lava fountains also generated pyroclastic flows consisting of basaltic tephra. This eruption style is reminiscent of large, explosive volcanic eruptions on Earth, like Laki in 1783.
At Tvashtar A, a large, dark whale-shaped volcanic region dominates. It is uncertain based on the current data if this region is a large lava lake that is only intermittently active or is an insulated lava flow that is again, only occasionally active. Only one unambiguous eruption was been detected at Tvashtar A in February 2000, with a pair of hot vents and a broad area of hot lava. Same story for Tvashtar D, though there is no evidence it has been active in the recent past. A region of dark basaltic lava had brightened between February 2000 and October 2001 showing that it was cool enough to allow sulfur and sulfur dioxide from the eruption at Tvashtar B to condense on it.
The awakening of Tvashtar since 1999 is likely the result of magma from a deep source at a depth of 30 kilometers (19 miles) that has become active again. Its depth, in addition to help feed massive lava curtains, can also allow it to feed magma to multiple volcanoes. That's why you can see one eruption at Tvashtar B and a few months later an eruption can get started up at Tvashtar A. A similar situation was seen after the Thor eruption in August 2001. Small volcanoes nearby, which had also never been seen as active before 2001, came out of dormancy at about the same time. Kami-Nari experienced a phreato-magmatic eruption two years after the nearby Pillan eruption. Io's heavily fractured lithosphere can facilitate the movement of magma from these deep reservoirs to either shallow magma reservoirs (likely the case for Tvashtar A and D) or directly to the surface as dikes during intense, outburst eruptions (the case for Tvashtar B, maybe C too). The latter case can also transition to the former, as the dikes also feed sills below the volcano. These sills can later grow into shallow magma reservoirs. These provide a more consistent source of lava that can support persistent eruptions like Prometheus or Amirani.
Conclusion
Tvashtar is one of the most well imaged volcanoes on Io with three sequences at spatial scales between 183 and 315 meters (600-1,033 feet) per pixel. This imaging permitted Galileo researchers to study an outburst eruption up-close and changes in the distribution of pyroclastic deposits and lava flows as a result of these intense eruptions. The geology of this region is also intriguing, with a large plateau surrounding much of Tvashtar Paterae. This plateau is marked by evidence of sapping that has eroded the plateau back, in some cases forming canyons 40 kilometers (25 miles) long.
Next week's volcano of the week is Shamshu Patera, a volcano with not nearly as intense eruptions of Tvashtar. Over the next month, we will also look at Isum, Maasaw, and Loki. While Maasaw has been fairly quiet, both Isum and Loki have had very unique eruption styles that will be interesting to examine.
References:
Leone, G.; L. Wilson. (2001). "Density structure of Io and the migration of magma through its lithosphere". Journal of Geophysical Research 106 (E12): 32,983–32,995.
Spencer, J.; et al. (2007). "Io Volcanism Seen by New Horizons: A Major Eruption of the Tvashtar Volcano". Science 318 (5848): 240–243.
Laver, C.; et al. (2007). "Tvashtar awakening detected in April 2006 with OSIRIS at the W.M. Keck Observatory". Icarus 191: 749–754.
Don't forget to check out the previous two parts of our series on Tvashtar Paterae, if you haven't already done so! Part One - Part Two. This article is also part of our broader series where we examine one Ionian volcano each week.
The Tvashtari Reawakening
Throughout the 2000s, Io was imaged on numerous occasions using the adaptive optics system at the European Southern Observatory and Keck II telescopes. These two large telescopes use adaptive optics to partially correct for atmospheric effects on data acquired at these telescopes. Much of the data acquired of the Tvashtar region since of the end of the Galileo mission has been taken at the Keck II, 10-meter telescope at Mauna Kea in Hawaii. Other facilities have been used, of course, to monitor Io's active volcanism, but they often use techniques that only work for Io's Jupiter-facing hemisphere, on the other side of the moon from Tvashtar. After correcting for atmospheric effects, researchers using Keck II to observe Io can achieve a spatial resolution of 120 kilometers at near-infrared wavelengths. Unfortunately, because time on this one telescope is very limited, only a few nights each year were available to observe Io, and when you combine the possibility of inclement weather at Mauna Kea and the fact that Tvashtar wasn't always on the visible hemisphere, you can tell that there weren't many opportunities to observe Tvashtar. As far as I can tell from what has been published and what is online, between the [effective] end of the Galileo mission and the New Horizons flyby, the Keck group, which includes Franck Marchis, Imke de Pater, and Conor Laver, observed Tvashtar on: 12/22/2001, 12/26/2001, 03/08/2003, 05/29/2004, 04/17/2006, and 06/02/2006. Between at least December 2001 and May 2004, Tvashtar was not seen in Keck data. This suggests that it had become quiescent enough to not have any lava hot enough to produce detectable thermal emission.
However, the data from 2006 showed that Tvashtar had cut short its vacation and became more active. Intense thermal hotspots were observed at Tvashtar during observing runs on April 17 and June 2, 2006. The emitted power seen on June 2, the higher resolution of the two runs, was 7.7 ± 0.9 × 10¹² W, more than twice that seen at Pillan during its eruption in 1997, but still an order of magnitude less power than released at the most powerful volcanic eruption ever seen by humans, the Surt eruption in February 2001. Laver, de Pater, and Marchis published their data a year later, finding a blackbody temperature of 1240 K for June 2 data. This measurement was aided by the use of the then-new OSIRIS camera at Keck, which acquires high-spectral resolution data for each pixel, much like NIMS on Galileo, VIMS on Cassini, and CRISM on the Mars Reconnaissance Orbiter. Comparison between images like those at left with a Galileo/Voyager basemap revealed that the hotspot was centered at 59 ± 1 N, 121.5 ± 1W, placing Tvashtar C within the error box [see the map I posted yesterday for the letters used for the different volcanoes at Tvashtar]. The area covered by this basaltic lava was estimated at 57 km2 (14,100 acres), consistent with the size of Tvashtar C. However, given the size of the hotspot and the resolution of the available data, it is not impossible that it was located a bit farther to the north, at Tvashtar B (the site of the November 1999 and December 2000 outbursts).
Operation: New Horizons
A few months before Tvashtar re-awakened, the New Horizons spacecraft was launched from Cape Canaveral, bound for the then-most distant planet in the Solar System, Pluto. To get all the way out to that distant world in a timeframe that wasn't ridiculously long, the spacecraft was launched on the fastest trajectory of any interplanetary spacecraft, and even then it required a gravity assist at Jupiter to fine-tune its path and to boost its velocity to get out to Pluto in 2015. This gravity assist at Jupiter took place on February 28, 2007, providing an opportunity to test the spacecraft's instruments on the many worlds of the Jupiter system. More than 190 images were acquired during this encounter of Io by LORRI, a high-spatial resolution camera system with a single, broadband band pass. Additional data was taken by MVIC, a lower-spatial resolution, 5-filter camera that covers visible and near-infrared wavelengths, and LEISA, a near-infrared mapping spectrometer.
A couple of weeks before New Horizons made it closest approach to Jupiter and Io, John Spencer and Kandis Lea Jessup observed Io using WFPC2 on the Hubble Space Telescope. Images taken on February 14 and a week later on February 21 revealed a large plume over Tvashtar Paterae, not unlike the one seen by Cassini in December 2000. While the plume was only seen in ultraviolet filter images, it was hoped that the plume would still be visible at high angles in New Horizons images.
When New Horizons started imaging on February 24, 2007, it turned out to be even better than that. A large volcanic plume, 350 kilometers (220 miles) in height, was visible in early, low-phase angle images of Io. The near-polar position of Tvashtar also meant that the plume was visible in nearly every image taken by New Horizons. This data also revealed a new red ring deposit surrounding Tvashtar Paterae as a result of this plume. In one case, repeated imaging over the course of eight minutes allowed John Spencer and his group to track clumps within the plume as they descended from the crest of the plume to the surface. Their motions are consistent with sulfur and sulfur dioxide gas condensing at a shock front at the top of the plume (rather than dust particles rising with expanding gases, like at Prometheus), then descending as it flows down along the shock flow front. The clumps likely form from electrostatic forces either generated by the interaction of plume particles (doubtful considering the spacing between individual grains) or from electrons brought in by Jupiter's magnetic field or the flux tube that connects Jupiter and Io. The fact that the plume was so easily visible in LORRI and MVIC images suggests that plume contained more dust than other giant plumes like Pele's or the Tvashtar plume seen in 2000.
A thermal hot spot was also seen at Tvashtar by all three cameras on New Horizons (neglecting ALICE since it barely resolved Io). The high-resolution data acquired by LORRI (~10-20 kilometers per pixel) allows the eruption site to be determined, corresponding with the southern half of Tvashtar B. This was also the site of the December 2000 outburst that also produced a large volcanic plume and high thermal emission. Using the LEISA spectrometer, temperatures around 1250 K were found, though the detection of a hotspot in daylight images with the visible light LORRI would suggest that higher temperature components are likely as part of an active lava fountain or curtain.
Eruption styles
The volcanic eruptions seen at Tvashtar since 1999 suggests that certain volcanoes experience specific eruption styles. For example, Tvashtar B was the site of three, maybe four, large outburst eruptions over a period of a little over seven years. Each of these eruptions involved lava fountains that generated intense thermal emission, even at visible wavelengths. The 2006 eruption by itself generated about 7% of the total power output of all of Io's volcanoes put together. That eruption may have occurred at the small Tvashtar C patera instead, but no prior eruption had been seen there except for some faint thermal emission seen by NIMS in August 2001. Based on observations of the 1999 eruption, these eruptions don't last very long, less than three months, or transition from one type of eruption to another, as the lava fountaining phase transitions to open lava channels flowing out across the surface, and later to one dominated by insulated flows where lava is transported through lava tubes, limiting the visibility of hot lava to remote sensing. Dark diffuse deposits surrounding Tvashtar B show these lava fountains also generated pyroclastic flows consisting of basaltic tephra. This eruption style is reminiscent of large, explosive volcanic eruptions on Earth, like Laki in 1783.
At Tvashtar A, a large, dark whale-shaped volcanic region dominates. It is uncertain based on the current data if this region is a large lava lake that is only intermittently active or is an insulated lava flow that is again, only occasionally active. Only one unambiguous eruption was been detected at Tvashtar A in February 2000, with a pair of hot vents and a broad area of hot lava. Same story for Tvashtar D, though there is no evidence it has been active in the recent past. A region of dark basaltic lava had brightened between February 2000 and October 2001 showing that it was cool enough to allow sulfur and sulfur dioxide from the eruption at Tvashtar B to condense on it.
The awakening of Tvashtar since 1999 is likely the result of magma from a deep source at a depth of 30 kilometers (19 miles) that has become active again. Its depth, in addition to help feed massive lava curtains, can also allow it to feed magma to multiple volcanoes. That's why you can see one eruption at Tvashtar B and a few months later an eruption can get started up at Tvashtar A. A similar situation was seen after the Thor eruption in August 2001. Small volcanoes nearby, which had also never been seen as active before 2001, came out of dormancy at about the same time. Kami-Nari experienced a phreato-magmatic eruption two years after the nearby Pillan eruption. Io's heavily fractured lithosphere can facilitate the movement of magma from these deep reservoirs to either shallow magma reservoirs (likely the case for Tvashtar A and D) or directly to the surface as dikes during intense, outburst eruptions (the case for Tvashtar B, maybe C too). The latter case can also transition to the former, as the dikes also feed sills below the volcano. These sills can later grow into shallow magma reservoirs. These provide a more consistent source of lava that can support persistent eruptions like Prometheus or Amirani.
Conclusion
Tvashtar is one of the most well imaged volcanoes on Io with three sequences at spatial scales between 183 and 315 meters (600-1,033 feet) per pixel. This imaging permitted Galileo researchers to study an outburst eruption up-close and changes in the distribution of pyroclastic deposits and lava flows as a result of these intense eruptions. The geology of this region is also intriguing, with a large plateau surrounding much of Tvashtar Paterae. This plateau is marked by evidence of sapping that has eroded the plateau back, in some cases forming canyons 40 kilometers (25 miles) long.
Next week's volcano of the week is Shamshu Patera, a volcano with not nearly as intense eruptions of Tvashtar. Over the next month, we will also look at Isum, Maasaw, and Loki. While Maasaw has been fairly quiet, both Isum and Loki have had very unique eruption styles that will be interesting to examine.
References:
Leone, G.; L. Wilson. (2001). "Density structure of Io and the migration of magma through its lithosphere". Journal of Geophysical Research 106 (E12): 32,983–32,995.
Spencer, J.; et al. (2007). "Io Volcanism Seen by New Horizons: A Major Eruption of the Tvashtar Volcano". Science 318 (5848): 240–243.
Laver, C.; et al. (2007). "Tvashtar awakening detected in April 2006 with OSIRIS at the W.M. Keck Observatory". Icarus 191: 749–754.
Filed Under:
Franck Marchis,
Geology,
New Horizons,
Reprocessing,
Tvashtar,
Volcanism
Tuesday, August 31, 2010
Io Volcano of the Week: Tvashtar - Part Two
This week, for our series covering one Ionian volcano each week, we are taking a look at a large volcanic region in Io's north polar region, Tvashtar Paterae. Yesterday for part one, we took a closer look at some of the images Galileo acquired and the geology of this region. In summary, Tvashtar Paterae is a string of four volcanoes that show various signs of recent or current volcanic activity. Three of these volcanic depressions, or paterae, are surrounded by a U-shaped mountain that has been modified by sulfur dioxide sapping, forming canyons that cut as deep as 40 kilometers (25 miles) into the plateau, and slumping. Today, we focus on the intense volcanic activity observed at Tvashtar during the Galileo mission, mainly between November 1999 and October 2001. Tomorrow, we will focus on more recent volcanism at Tvashtar, including the outburst that accompanied the New Horizons flyby in February 2007. We will also summarize what the eruption style at Tvashtar tells about how its lavas are fed.
Before I continue, I should point out the image at above right. I have labeled each of the four volcanoes at Tvashtar: A, B, C, and D. I hope this reduces confusion over the next two articles about which volcano I am referring to. So if I discuss an eruption at Tvashtar B, I am referring to the second volcano from the left. Tvashtar A is the large, heart-shaped volcano with the whale-shaped lava flow/lake on the northwest end of Tvashtar Paterae. Tvashtar C is the small patera with the faint lava flows that radiate out to its north and east. Tvashtar D is the steep-sided, kidney-shaped patera with a dark lava flow covering its southern half on the southeastern end of Tvashtar Paterae.
Million-to-one shot, Doc. Million-to-one.
It is hard to believe now after more than 10 years of observing various Tvashtar eruptions that prior to the outburst eruption of November 1999, a faint thermal hotspot, resulting from an excess of near-infrared energy being emitted by cooling lava flows, was seen at Tvashtar on only two occasions: by the Galileo SSI camera in April 1997 when the moon was in Jupiter's shadow and by Franck Marchis and his colleagues at the European Southern Observatory (ESO) on September 30, 1999. Over the period between the Voyager flybys in 1979 and the Galileo encounter with Io in November 1999, there doesn't appear to be any evidence for surface changes in and around Tvashtar Paterae. There were a few patches of dark material seen in color data acquired in July 1999 that represent lava flows or lakes that were active before then, including two dark regions in Tvashtar A, a 25-kilometer (16-mile) long L-shaped flow in Tvashtar B, and a dark region covering the southern half of Tvashtar D. So volcanism was a common geologic process at Tvashtar, but during the Galileo mission and perhaps during the 16 years leading up to it, the region had been largely dormant except for a pair of small, precursor eruptions.
Tvashtar's dormancy came to a crashing halt on November 26, 1999. In conjunction with the Galileo flyby of Io occurring that day, Bob Howell of the University of Wyoming used the NSFCAM at NASA's Infrared Telescope Facility (IRTF) in Hawaii to image Io a few hours after Galileo's encounter. His images revealed a bright hotspot at Tvashtar, one of a rare class of intense outburst eruptions. Images taken by Franck Marchis and his group at ESO and infrared photometry taken at the IRTF and the Wyoming Infrared Observatory (WIRO) revealing only a faint hotspot at Tvashtar provide time constraints for the start of the eruption to sometime after November 24. Howell estimates that such eruptions are occurring 2–4.5% of the time somewhere on Io. Assuming that the most intense period of a volcanic eruption on Io last approximately two days before calming down, this suggests that approximately six such eruptions occur each year somewhere on Io. At least two others were observed by ground-based observers in 1999: at Grian Patera in June and at either Tawhaki or Gish Bar in August. So the chances that Galileo would be able to image an eruption such as these at high resolution without knowing where an eruption might occur, given the amount of coverage it acquired during an individual flyby (~2–4% of the surface), were pretty slim.
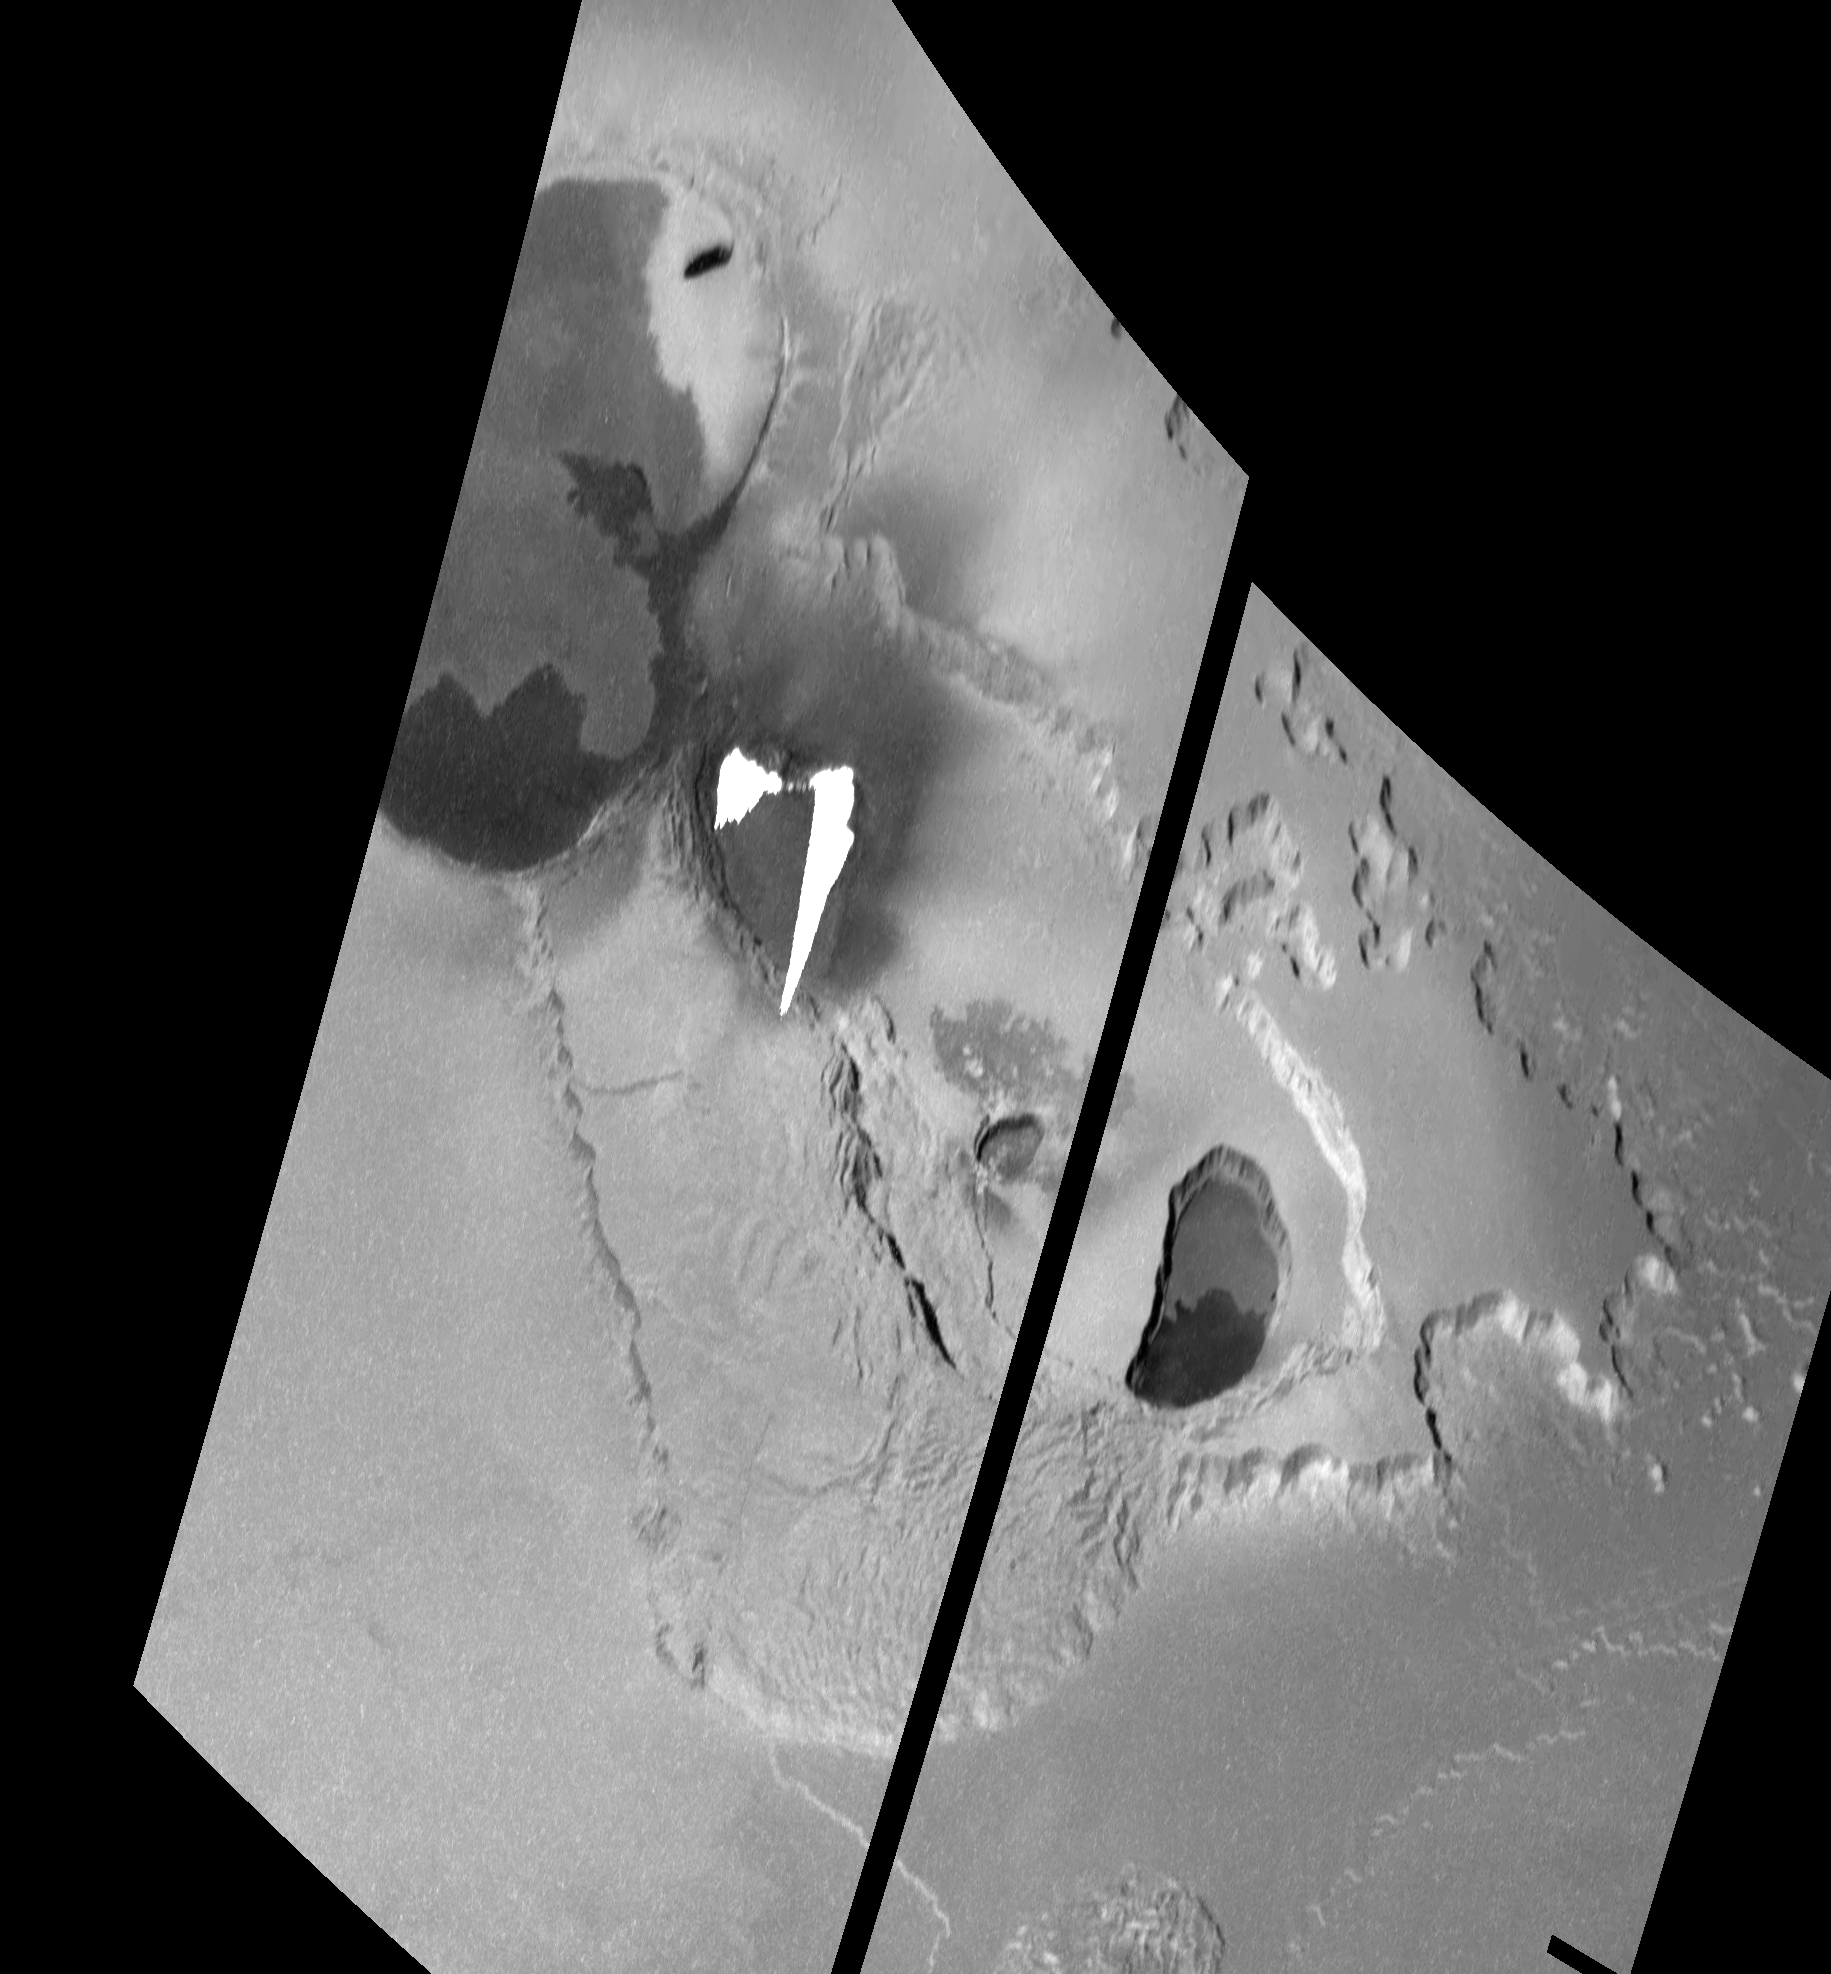
However, it just so happened that the Galileo imaging team had targeted Tvashtar for a two-frame mosaic during Galileo's I25 encounter on the day of the most intense period of the eruption. More luck came when Galileo engineers were able to send up commands quickly enough to bring the spacecraft out of safe mode before the Tvashtar observation was to be taken. The safing event also ensured that there would be enough downlink time to return all of the images in this mosaic, as the higher-priority, high-resolution observations were not taken. These images were returned in early December and revealed a pair of over-exposed streaks along the northern margin of Tvashtar B. These streaks resulted from bleeding in the CCD detector array in Galileo's SSI camera. Based on their knowledge of how this type of camera overexposure occurs, Galileo imaging scientists were able to reconstruct the geometry of the exposed, hot lava that caused it. Assuming that the fissure it originated from was roughly linear, they estimated that the bleeding area was caused by the intense thermal emission from a curtain of lava that reached 1.5 kilometers (5,000 feet) into the cold, Ionian sky. This lava curtain, or line of lava fountains, was split into two main sections along the western and eastern halves of a 25-kilometer (16-mile) long fissure vent that runs along the northern edge of the floor of Tvashtar B. Considering the global rate of outburst-class eruptions (~3-6 eruptions with a VEI > 4–5), it was incredibly fortuitous to observe at high resolution such a rare class of Ionian eruption.
To better understand how this bleeding occurs and how they were able to estimate the height of the lava curtain, let's use some *shock* horrible, over-used analogies. Imagine that each of the 640,000 pixels of the Charged-coupled detector (CCD) on Galileo's camera is like a bucket that you fill with photons, which are converted to electrical charge in the bucket. The number of photons it takes to fill the bucket (pixel, or DN, value of 255 in an 8-bit camera) is defined by the observation's gain state (lower gain states mean fewer photons can fill the bucket, higher gain states require more), and the time you leave the bucket out to be filled is defined by the exposure time. Filter selection and the sensitivity of the silicon the CCD was made out of constrains the types of photons (wavelengths) you allow in the bucket. When the bucket is filled with so many photons that it overflows, or saturates, photons pour out into the buckets, or pixels, above and below it in the detector array. How this overflow or bleeding develops was determine through calibration of the camera system. For every bucket or pixel above the original over-exposed pixel that is itself overflowing, nine pixels are filled below it. The longest column of bleeding consisted of 94 pixels, and taking into account the lava flow below the fissure, Milazzo et al. 2005 found that 11–16 of those pixels covered the lava curtain and flow. Milazzo et al. estimated that the lava fountains on the western end of the fissure, least contaminated by the presence of a lava flow on the ground, were 360–900 meters (1,180–2,950 feet) tall.
Adding up all the electric charge caused by the intensity of photons from this eruptions and the exposure time of the image, they found an electron flux, corresponding to the rate at which photons filled those pixels, of between 0.94 and 1.8 × 10⁸ e- pixel-1 s-1, which corresponds with lower limit on the brightness temperature of 1300–1350 K. Similar brightness temperatures were detected at the western end of the fissure. Spectra from the Near-Infrared Mapping Spectrometer (NIMS), taken as the instrument rode along with the SSI mosaic observation, also covered a portion of the lava curtain, though much of their data over the eruption was also saturated. Using a non-saturated pixel in Tvashtar B, Lopes et al. 2001 found a color temperature for the hot component of 1060 ± 60 K. This was considered a lower limit since the unsaturated pixel used did not cover the hottest areas seen by SSI, other NIMS pixels that were saturated likely covered areas that were hotter, and the influence of reflected sunlight all cause measured temperatures to be underestimates.
Tvashtar: Master of its (thermal) domain
To follow up on the November 1999 observation of an outburst at Tvashtar, an eruption they could pin down to a specific date, Galileo observed Tvashtar during an encounter on February 22, 2000 (also known as I27) using images with a scale of 315 meters (1,033 feet) per pixel. This observation used five images at different filters (violet, clear, 756 nm, 889 nm, and 968 nm) to measure lava temperatures more accurately than was possible in the I25 data and to determine the silicate composition of the lava by looking for an absorption band around 900 nm that is thought to be formed by orthopyroxene, a mineral found in basalt and other mafic igneous rocks. A composite of these images is shown at right. As you can see, the activity at Tvashtar B had largely shut down, leaving behind a dark lava flow that matches the appearance of an older flow seen before the eruption. This is confirmed by color temperatures measured by NIMS of between 500 and 600 K, indicative of cooling silicate lava and/or very small exposures of fresh lava.
While B had quieted down, Tvashtar A had heated up. Images acquired using filters that were sensitive to near-infrared light revealed glowing lava within much of a whale-shaped lava flow that runs along the southern and eastern end of Tvashtar A. These thermal hotspots were not seen in the clear-filter data in November 1999. Small glowing hotspots were also visible at the end of each of the flukes of the "whale" (note to John Spencer: I think it looks like a whale, and since this is my blog, I can say it looks like a whale, so there :-p ). These hotspots are possibly the source of the lava that is seen glowing at a cooler temperature farther south and west. Milazzo et al. 2005 measured a color temperature of at least 1220 K for these small hotspots. Farther south and west, the dark region within Tvashtar A glowed to the point that it saturated the camera's detector in places in the 889 nm and 968 nm filter images. This shows up as the red and orange area within the flows in the image above. Milazzo found a mean temperature of the unsaturated pixels in this region to be approximately 1300 K, though higher temperatures or greater fractional areas (the more likely of the two) is possible in the saturated pixels. Given the high temperature of this large region, a cooling lava flow is unlikely. Milazzo suggests that this area maybe a lava flow that is fed by lava tubes and flows mostly below a cooled lava crust, in which case the thermal emission observes comes from sub-pixel skylights, or the area is one big lava lake that is only intermittently active. I know Moses favored the lava lake hypothesis, but in reality, a mixture of eruption styles was likely.
Tvashtar remained active into late 2000 when Galileo and the passing Cassini spacecraft made joint observations Io and the Jovian system. While Cassini observed Io from ten times farther away than Galileo, the increased wavelength coverage its camera provided allowed researchers to observe more gas-rich plumes, like Pele's, as well as detect a thermal hotspot at that volcano. Using such images taken at ultraviolet wavelengths, a large volcanic plume with a height of 385 kilometers (240 miles) was observed over Tvashtar Paterae by the Cassini ISS. This corresponds with a red oval plume deposit, seen in Galileo images taken on December 30, 2000, that encircles Tvashtar. This deposit is quite similar to the one that surrounds the volcano Pele, and suggests that the plume was enriched with elemental sulfur enough to form an optically thick layer of S4 on the surface. This plume accompanied yet another intense, outburst eruption, observed from Earth by Marchis et al. using the adaptive optics system at the 10-meter Keck II telescope in Hawaii. Tvashtar remained active in observations from Keck taken on February 19, 2001, but it was less energetic than it was in December 2000. The area and temperature reported by Marchis et al. 2002 was consistent with a cooling lava flow with only a moderate amount of new activity, relative to the intense, lava fountain-enhanced eruptions seen in November 1999 and December 2000.
During the next two Io flybys on August 6 and October 16, 2001, Galileo took advantage of several opportunities to image Tvashtar up-close in the wake of these intense eruptions. The best of these two flybys for observing Tvashtar was the first (I31) as the spacecraft flew nearly directly over the volcano at an altitude of 300 kilometers (186 miles), within the plume seen by Cassini. Two very-high-resolution observations were planned by Galileo SSI during the encounter: a 6-frame mosaic at 3-5 meters (10-16 feet) per pixel across the I25 vent region in Tvashtar B and its northern patera wall and a 6-frame, context mosaic at 50 meters (164 feet) per pixel that covered Tvashtar B and portions of Tvashtar Mensae to its north. Unfortunately, due to a camera anomaly, these observations were lost. Low-resolution global images at 19.6 kilometers (12.2 miles) per pixel showed that the plume deposit encircling Tvashtar that Galileo observed in December 2000 had faded quite a bit due a mix of relative inactivity and deposits from a fresh eruption at Thor to the southwest of Tvashtar. NIMS was not affected by the SSI anomaly and took high quality data over Tvashtar during this encounter. This observation revealed the complex distribution of warm lava and pyroclasts across the Tvashtar portion. The main red hotspot in the data shown at above left corresponds with the likely source for the December 2000 plume and lava fountains along the southwestern wall of Tvashtar B. Two additional hotspots are visible at the lava flow that formed during the November 1999 eruption and along the northeastern margin of Tvashtar A. Fainter flows were also detected from the whale-shaped flow in Tvashtar A and from Tvashtar C.
Galileo's final opportunity to image Tvashtar came on October 16, 2001 during its I32 flyby of Io. This time Galileo flew over Io's south polar region, leaving only an opportunity to image Tvashtar at a more oblique angle later in the flyby. The resulting two frame mosaic, at 200 meters (656 feet) per pixel, does reveal changes that occurred at Tvashtar as a result of the December 2000 volcanic eruption. These include a fresh lava flow across portions of Tvashtar B, likely forming during the eruption seen by Cassini and fresh pyroclastic deposits to the east and southwest of that patera. The extent of these dark deposits is consistent with the type of volatile-rich volcanic eruption that would also spawn a 400-kilometer-high, sulfur-rich, volcanic gas plume. New dark material was also seen along the northeastern edge of Tvashtar A, the site of a NIMS hot spot in August 2001. This suggest that volcanic activity had gotten going in the interval between the I27 and I32 SSI observations there as well. The distribution of this fresh dark material with a new pyroclastic deposit as it appears to cover both the edge of the patera floor and the terraced wall above it, though the NIMS observations suggests that at least some lava flowed out from this vent. Finally, the dark lava flows that covered the southern half of Tvashtar D had pretty much faded by October 2001.
The Tvashtar region endured a series of violent volcanic eruptions between November 1999 through at least December 2000, and Galileo and Cassini had front row seats to the action. Galileo observations from the SSI camera and NIMS spectrometer indicated that volcanic activity in the region was waning throughout 2001, with much of the thermal emission coming from older, cooling lava flows, though some fresh activity was likely at Tvashtar B and in parts of Tvashtar A and C as late as August 2001. However, by December 2001, ground-based observations from Keck showed that Tvashtar had quieted down to the point that it was no longer detectable using their instruments. However, that was not all she wrote for Tvashtar. As we will see tomorrow, there are third and fourth acts for Io's volcanoes as we examine observations of Tvashtar from ground-based telescopes and the New Horizons spacecraft after Galileo's mission ended. Tomorrow, we will also discuss what the various eruption styles at Tvashtar tells us about how its lavas are fed.
References:
McEwen, A. S.; et al. (2000). "Galileo at Io: Results from High-Resolution Imaging". Science 288 (5469): 1,193–1,198.
Keszthelyi, L.; et al. (2001). "Imaging of volcanic activity on Jupiter's moon Io by Galileo during the Galileo Europa Mission and the Galileo Millennium Mission". Journal of Geophysical Research 106 (E12): 33,025–33,052.
Lopes, R. M. C.; et al. (2001). "Io in the near infrared: Near-Infrared Mapping Spectrometer (NIMS) results from the Galileo flybys in 1999 and 2000". Journal of Geophysical Research 106 (E12): 33,053–33,078.
Howell, R. R.; et al. (2001). "Ground-based observations of volcanism on Io in 1999 and early 2000". Journal of Geophysical Research 106 (E12): 33,129–33,139.
Marchis, F.; et al. (2001). "A survey of Io's volcanism by adaptive optics observations in the 3.8-μm thermal band (1996-1999)". Journal of Geophysical Research 106 (E12): 33,141–33,159.
Marchis, F.; et al. (2002). "High-Resolution Keck Adaptive Optics Imaging of Violent Volcanic Activity on Io". Icarus 160: 124–131.
Porco, C.; et al. (2003). "Cassini Imaging of Jupiter’s Atmosphere, Satellites, and Rings". Science 299 (5612): 1,541–1,547.
Turtle, E.; et al. (2004). "The final Galileo SSI observations of Io: orbits G28-I33". Icarus 169: 3–28.
Milazzo, M.; et al. (2005). "Volcanic activity at Tvashtar Catena, Io". Icarus 179: 235–251.
Lopes, R.; et al. (2004). "Lava lakes on Io: observations of Io’s volcanic activity from Galileo NIMS during the 2001 fly-bys". Icarus 169: 140–174.
Before I continue, I should point out the image at above right. I have labeled each of the four volcanoes at Tvashtar: A, B, C, and D. I hope this reduces confusion over the next two articles about which volcano I am referring to. So if I discuss an eruption at Tvashtar B, I am referring to the second volcano from the left. Tvashtar A is the large, heart-shaped volcano with the whale-shaped lava flow/lake on the northwest end of Tvashtar Paterae. Tvashtar C is the small patera with the faint lava flows that radiate out to its north and east. Tvashtar D is the steep-sided, kidney-shaped patera with a dark lava flow covering its southern half on the southeastern end of Tvashtar Paterae.
Million-to-one shot, Doc. Million-to-one.
It is hard to believe now after more than 10 years of observing various Tvashtar eruptions that prior to the outburst eruption of November 1999, a faint thermal hotspot, resulting from an excess of near-infrared energy being emitted by cooling lava flows, was seen at Tvashtar on only two occasions: by the Galileo SSI camera in April 1997 when the moon was in Jupiter's shadow and by Franck Marchis and his colleagues at the European Southern Observatory (ESO) on September 30, 1999. Over the period between the Voyager flybys in 1979 and the Galileo encounter with Io in November 1999, there doesn't appear to be any evidence for surface changes in and around Tvashtar Paterae. There were a few patches of dark material seen in color data acquired in July 1999 that represent lava flows or lakes that were active before then, including two dark regions in Tvashtar A, a 25-kilometer (16-mile) long L-shaped flow in Tvashtar B, and a dark region covering the southern half of Tvashtar D. So volcanism was a common geologic process at Tvashtar, but during the Galileo mission and perhaps during the 16 years leading up to it, the region had been largely dormant except for a pair of small, precursor eruptions.
Tvashtar's dormancy came to a crashing halt on November 26, 1999. In conjunction with the Galileo flyby of Io occurring that day, Bob Howell of the University of Wyoming used the NSFCAM at NASA's Infrared Telescope Facility (IRTF) in Hawaii to image Io a few hours after Galileo's encounter. His images revealed a bright hotspot at Tvashtar, one of a rare class of intense outburst eruptions. Images taken by Franck Marchis and his group at ESO and infrared photometry taken at the IRTF and the Wyoming Infrared Observatory (WIRO) revealing only a faint hotspot at Tvashtar provide time constraints for the start of the eruption to sometime after November 24. Howell estimates that such eruptions are occurring 2–4.5% of the time somewhere on Io. Assuming that the most intense period of a volcanic eruption on Io last approximately two days before calming down, this suggests that approximately six such eruptions occur each year somewhere on Io. At least two others were observed by ground-based observers in 1999: at Grian Patera in June and at either Tawhaki or Gish Bar in August. So the chances that Galileo would be able to image an eruption such as these at high resolution without knowing where an eruption might occur, given the amount of coverage it acquired during an individual flyby (~2–4% of the surface), were pretty slim.
However, it just so happened that the Galileo imaging team had targeted Tvashtar for a two-frame mosaic during Galileo's I25 encounter on the day of the most intense period of the eruption. More luck came when Galileo engineers were able to send up commands quickly enough to bring the spacecraft out of safe mode before the Tvashtar observation was to be taken. The safing event also ensured that there would be enough downlink time to return all of the images in this mosaic, as the higher-priority, high-resolution observations were not taken. These images were returned in early December and revealed a pair of over-exposed streaks along the northern margin of Tvashtar B. These streaks resulted from bleeding in the CCD detector array in Galileo's SSI camera. Based on their knowledge of how this type of camera overexposure occurs, Galileo imaging scientists were able to reconstruct the geometry of the exposed, hot lava that caused it. Assuming that the fissure it originated from was roughly linear, they estimated that the bleeding area was caused by the intense thermal emission from a curtain of lava that reached 1.5 kilometers (5,000 feet) into the cold, Ionian sky. This lava curtain, or line of lava fountains, was split into two main sections along the western and eastern halves of a 25-kilometer (16-mile) long fissure vent that runs along the northern edge of the floor of Tvashtar B. Considering the global rate of outburst-class eruptions (~3-6 eruptions with a VEI > 4–5), it was incredibly fortuitous to observe at high resolution such a rare class of Ionian eruption.
To better understand how this bleeding occurs and how they were able to estimate the height of the lava curtain, let's use some *shock* horrible, over-used analogies. Imagine that each of the 640,000 pixels of the Charged-coupled detector (CCD) on Galileo's camera is like a bucket that you fill with photons, which are converted to electrical charge in the bucket. The number of photons it takes to fill the bucket (pixel, or DN, value of 255 in an 8-bit camera) is defined by the observation's gain state (lower gain states mean fewer photons can fill the bucket, higher gain states require more), and the time you leave the bucket out to be filled is defined by the exposure time. Filter selection and the sensitivity of the silicon the CCD was made out of constrains the types of photons (wavelengths) you allow in the bucket. When the bucket is filled with so many photons that it overflows, or saturates, photons pour out into the buckets, or pixels, above and below it in the detector array. How this overflow or bleeding develops was determine through calibration of the camera system. For every bucket or pixel above the original over-exposed pixel that is itself overflowing, nine pixels are filled below it. The longest column of bleeding consisted of 94 pixels, and taking into account the lava flow below the fissure, Milazzo et al. 2005 found that 11–16 of those pixels covered the lava curtain and flow. Milazzo et al. estimated that the lava fountains on the western end of the fissure, least contaminated by the presence of a lava flow on the ground, were 360–900 meters (1,180–2,950 feet) tall.
Adding up all the electric charge caused by the intensity of photons from this eruptions and the exposure time of the image, they found an electron flux, corresponding to the rate at which photons filled those pixels, of between 0.94 and 1.8 × 10⁸ e- pixel-1 s-1, which corresponds with lower limit on the brightness temperature of 1300–1350 K. Similar brightness temperatures were detected at the western end of the fissure. Spectra from the Near-Infrared Mapping Spectrometer (NIMS), taken as the instrument rode along with the SSI mosaic observation, also covered a portion of the lava curtain, though much of their data over the eruption was also saturated. Using a non-saturated pixel in Tvashtar B, Lopes et al. 2001 found a color temperature for the hot component of 1060 ± 60 K. This was considered a lower limit since the unsaturated pixel used did not cover the hottest areas seen by SSI, other NIMS pixels that were saturated likely covered areas that were hotter, and the influence of reflected sunlight all cause measured temperatures to be underestimates.
Tvashtar: Master of its (thermal) domain
To follow up on the November 1999 observation of an outburst at Tvashtar, an eruption they could pin down to a specific date, Galileo observed Tvashtar during an encounter on February 22, 2000 (also known as I27) using images with a scale of 315 meters (1,033 feet) per pixel. This observation used five images at different filters (violet, clear, 756 nm, 889 nm, and 968 nm) to measure lava temperatures more accurately than was possible in the I25 data and to determine the silicate composition of the lava by looking for an absorption band around 900 nm that is thought to be formed by orthopyroxene, a mineral found in basalt and other mafic igneous rocks. A composite of these images is shown at right. As you can see, the activity at Tvashtar B had largely shut down, leaving behind a dark lava flow that matches the appearance of an older flow seen before the eruption. This is confirmed by color temperatures measured by NIMS of between 500 and 600 K, indicative of cooling silicate lava and/or very small exposures of fresh lava.
While B had quieted down, Tvashtar A had heated up. Images acquired using filters that were sensitive to near-infrared light revealed glowing lava within much of a whale-shaped lava flow that runs along the southern and eastern end of Tvashtar A. These thermal hotspots were not seen in the clear-filter data in November 1999. Small glowing hotspots were also visible at the end of each of the flukes of the "whale" (note to John Spencer: I think it looks like a whale, and since this is my blog, I can say it looks like a whale, so there :-p ). These hotspots are possibly the source of the lava that is seen glowing at a cooler temperature farther south and west. Milazzo et al. 2005 measured a color temperature of at least 1220 K for these small hotspots. Farther south and west, the dark region within Tvashtar A glowed to the point that it saturated the camera's detector in places in the 889 nm and 968 nm filter images. This shows up as the red and orange area within the flows in the image above. Milazzo found a mean temperature of the unsaturated pixels in this region to be approximately 1300 K, though higher temperatures or greater fractional areas (the more likely of the two) is possible in the saturated pixels. Given the high temperature of this large region, a cooling lava flow is unlikely. Milazzo suggests that this area maybe a lava flow that is fed by lava tubes and flows mostly below a cooled lava crust, in which case the thermal emission observes comes from sub-pixel skylights, or the area is one big lava lake that is only intermittently active. I know Moses favored the lava lake hypothesis, but in reality, a mixture of eruption styles was likely.
Tvashtar remained active into late 2000 when Galileo and the passing Cassini spacecraft made joint observations Io and the Jovian system. While Cassini observed Io from ten times farther away than Galileo, the increased wavelength coverage its camera provided allowed researchers to observe more gas-rich plumes, like Pele's, as well as detect a thermal hotspot at that volcano. Using such images taken at ultraviolet wavelengths, a large volcanic plume with a height of 385 kilometers (240 miles) was observed over Tvashtar Paterae by the Cassini ISS. This corresponds with a red oval plume deposit, seen in Galileo images taken on December 30, 2000, that encircles Tvashtar. This deposit is quite similar to the one that surrounds the volcano Pele, and suggests that the plume was enriched with elemental sulfur enough to form an optically thick layer of S4 on the surface. This plume accompanied yet another intense, outburst eruption, observed from Earth by Marchis et al. using the adaptive optics system at the 10-meter Keck II telescope in Hawaii. Tvashtar remained active in observations from Keck taken on February 19, 2001, but it was less energetic than it was in December 2000. The area and temperature reported by Marchis et al. 2002 was consistent with a cooling lava flow with only a moderate amount of new activity, relative to the intense, lava fountain-enhanced eruptions seen in November 1999 and December 2000.
During the next two Io flybys on August 6 and October 16, 2001, Galileo took advantage of several opportunities to image Tvashtar up-close in the wake of these intense eruptions. The best of these two flybys for observing Tvashtar was the first (I31) as the spacecraft flew nearly directly over the volcano at an altitude of 300 kilometers (186 miles), within the plume seen by Cassini. Two very-high-resolution observations were planned by Galileo SSI during the encounter: a 6-frame mosaic at 3-5 meters (10-16 feet) per pixel across the I25 vent region in Tvashtar B and its northern patera wall and a 6-frame, context mosaic at 50 meters (164 feet) per pixel that covered Tvashtar B and portions of Tvashtar Mensae to its north. Unfortunately, due to a camera anomaly, these observations were lost. Low-resolution global images at 19.6 kilometers (12.2 miles) per pixel showed that the plume deposit encircling Tvashtar that Galileo observed in December 2000 had faded quite a bit due a mix of relative inactivity and deposits from a fresh eruption at Thor to the southwest of Tvashtar. NIMS was not affected by the SSI anomaly and took high quality data over Tvashtar during this encounter. This observation revealed the complex distribution of warm lava and pyroclasts across the Tvashtar portion. The main red hotspot in the data shown at above left corresponds with the likely source for the December 2000 plume and lava fountains along the southwestern wall of Tvashtar B. Two additional hotspots are visible at the lava flow that formed during the November 1999 eruption and along the northeastern margin of Tvashtar A. Fainter flows were also detected from the whale-shaped flow in Tvashtar A and from Tvashtar C.
Galileo's final opportunity to image Tvashtar came on October 16, 2001 during its I32 flyby of Io. This time Galileo flew over Io's south polar region, leaving only an opportunity to image Tvashtar at a more oblique angle later in the flyby. The resulting two frame mosaic, at 200 meters (656 feet) per pixel, does reveal changes that occurred at Tvashtar as a result of the December 2000 volcanic eruption. These include a fresh lava flow across portions of Tvashtar B, likely forming during the eruption seen by Cassini and fresh pyroclastic deposits to the east and southwest of that patera. The extent of these dark deposits is consistent with the type of volatile-rich volcanic eruption that would also spawn a 400-kilometer-high, sulfur-rich, volcanic gas plume. New dark material was also seen along the northeastern edge of Tvashtar A, the site of a NIMS hot spot in August 2001. This suggest that volcanic activity had gotten going in the interval between the I27 and I32 SSI observations there as well. The distribution of this fresh dark material with a new pyroclastic deposit as it appears to cover both the edge of the patera floor and the terraced wall above it, though the NIMS observations suggests that at least some lava flowed out from this vent. Finally, the dark lava flows that covered the southern half of Tvashtar D had pretty much faded by October 2001.
The Tvashtar region endured a series of violent volcanic eruptions between November 1999 through at least December 2000, and Galileo and Cassini had front row seats to the action. Galileo observations from the SSI camera and NIMS spectrometer indicated that volcanic activity in the region was waning throughout 2001, with much of the thermal emission coming from older, cooling lava flows, though some fresh activity was likely at Tvashtar B and in parts of Tvashtar A and C as late as August 2001. However, by December 2001, ground-based observations from Keck showed that Tvashtar had quieted down to the point that it was no longer detectable using their instruments. However, that was not all she wrote for Tvashtar. As we will see tomorrow, there are third and fourth acts for Io's volcanoes as we examine observations of Tvashtar from ground-based telescopes and the New Horizons spacecraft after Galileo's mission ended. Tomorrow, we will also discuss what the various eruption styles at Tvashtar tells us about how its lavas are fed.
References:
McEwen, A. S.; et al. (2000). "Galileo at Io: Results from High-Resolution Imaging". Science 288 (5469): 1,193–1,198.
Keszthelyi, L.; et al. (2001). "Imaging of volcanic activity on Jupiter's moon Io by Galileo during the Galileo Europa Mission and the Galileo Millennium Mission". Journal of Geophysical Research 106 (E12): 33,025–33,052.
Lopes, R. M. C.; et al. (2001). "Io in the near infrared: Near-Infrared Mapping Spectrometer (NIMS) results from the Galileo flybys in 1999 and 2000". Journal of Geophysical Research 106 (E12): 33,053–33,078.
Howell, R. R.; et al. (2001). "Ground-based observations of volcanism on Io in 1999 and early 2000". Journal of Geophysical Research 106 (E12): 33,129–33,139.
Marchis, F.; et al. (2001). "A survey of Io's volcanism by adaptive optics observations in the 3.8-μm thermal band (1996-1999)". Journal of Geophysical Research 106 (E12): 33,141–33,159.
Marchis, F.; et al. (2002). "High-Resolution Keck Adaptive Optics Imaging of Violent Volcanic Activity on Io". Icarus 160: 124–131.
Porco, C.; et al. (2003). "Cassini Imaging of Jupiter’s Atmosphere, Satellites, and Rings". Science 299 (5612): 1,541–1,547.
Turtle, E.; et al. (2004). "The final Galileo SSI observations of Io: orbits G28-I33". Icarus 169: 3–28.
Milazzo, M.; et al. (2005). "Volcanic activity at Tvashtar Catena, Io". Icarus 179: 235–251.
Lopes, R.; et al. (2004). "Lava lakes on Io: observations of Io’s volcanic activity from Galileo NIMS during the 2001 fly-bys". Icarus 169: 140–174.
Filed Under:
Galileo,
Geology,
Reprocessing,
Tvashtar,
Volcanism
Io Volcano of the Week: Tvashtar - Part One
It is four for the price of one for this week's Io Volcano of the Week: Tvashtar Paterae. During the month of August, we have examined the five volcanoes that were imaged up-close by the Galileo spacecraft during its encounter with Io on November 26, 1999. During that flyby, Galileo acquired five observations with a scale of 160-280 meters or 525-920 feet per pixel (higher resolution observations were lost due to a spacecraft safing event). Thus far we have profiled Zal, Emakong, Hi'iaka, and Culann, active volcanoes seen across various parts of Io's leading hemisphere. This week, we travel to the great red north to Io's camera-loving volcano, Tvashtar Paterae. Due to the sheer amount of data acquired of and papers written about just this one volcanic region, I am going to split this discussion up in to (at least) three parts. Today, we will examine the geology of Tvashtar Paterae and the surrounding region, as well as the imagery Galileo returned of this volcano. Tomorrow, August 31, we will focus on the eruptions that occurred at Tvashtar during the Galileo mission. Finally, on Wednesday, September 1, we will examine the volcanic eruptions that have occurred there since the end of the mission, including the massive one that happened during the New Horizons flyby, and what these various eruptions tell us about how Tvashtar's lavas are supplied.
First, let's stick to the basics. Tvashtar Paterae is a chain of volcanic depressions located at 62.76° North Latitude, 123.53° West Longitude, placing it in the high northern latitudes of Io's anti-Jovian (i.e. the "far" side) and leading hemispheres. All together, Tvashtar measures 306 kilometers (190 miles) from its northwest to southeast ends. The volcanic region is named after Tvastar, a solar deity and blacksmith to the gods of the Vedic religion. Tvastar crafted, like Hephaestus for Zeus in Greek mythology, the thunderbolts of Indra and other magical implements. There are a number of Ionian volcanoes named after characters from Vedic and Hindu religious texts, such as Savitr (a large volcanic depression 300 kilometers, or 186 miles, south of Tvashtar), Surya, Vivasvant, Arusha, and Agni. Originally, the region was named Tvashtar Catena in 2000, using the IAU term for a string of craters, but that feature type was deprecated for Io in 2006, so the descriptor term was changed to the plural of patera (technically, an irregular depression, but used for Io as a geologic term for a volcanic depression).
Images
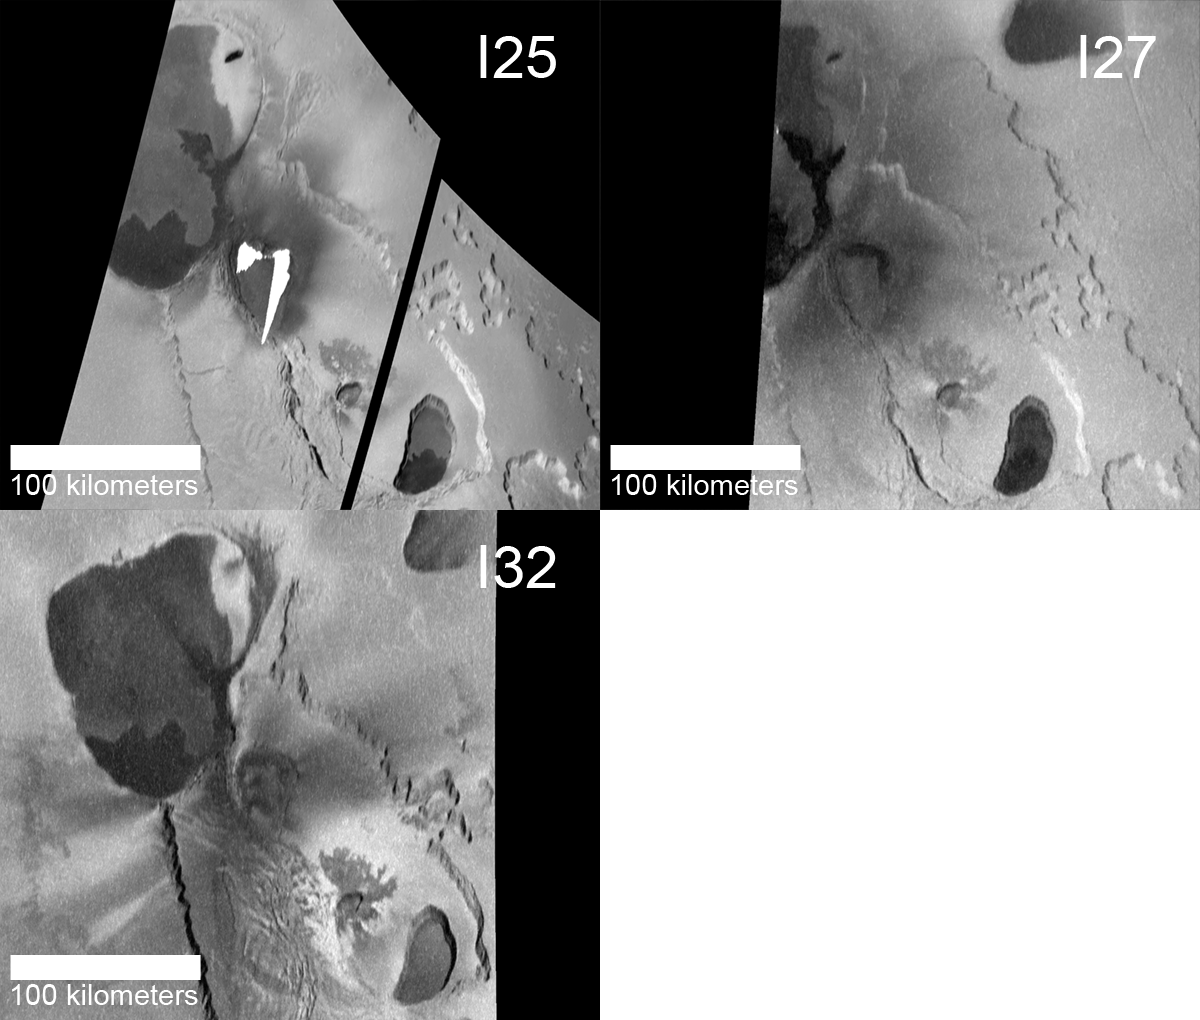
Before we get to the geology of Tvashtar Paterae, let's take a look at the available imagery, which you will see a lot of over the next few days on this blog. While it was clearly visible in global-scale images taken by the Voyagers and Galileo before (including the C21 global color mosaic, a portion of which is shown at the top of this article), Tvashtar was first imaged up-close on November 26, 1999 during Galileo's I25 flyby. This two-frame mosaic, with a scale of 183 meters (600 feet) per pixel, was originally designed as a 2 frame-by-4 frame mosaic that covered both Tvashtar and Savitr Patera to the south. The goal was to better understand the geology of giant paterae (i.e. volcanic depressions) that appeared to be common across Io's polar regions. Based on measurements made by Jani Radebaugh and her colleagues and published in 2001, the paterae at high latitudes are larger but less numerous, and these two large depressions were thought to be typical of this. Their eruption style also seemed to differ from volcanoes observed at lower latitudes. 25ISGIANTS01 was trimmed down to a 2-frame mosaic covering only Tvashtar Paterae in late October 1999 after the I24 flyby when the malfunction of the camera's summation mode meant that fewer frames could be taken given the available downlink. Frames also had to be cut because of the decision to use pre-downlink compression off the tape recorder, rather than the camera's on-board compression, for some of the images taken. The observation was returned slowly during December 1999, revealing a violent new eruption in the Tvashtar region.
As a result of the eruption there, Tvashtar was targeted for imaging on three of Galileo's four remaining Io flybys, in order to look for new activity and to monitor the region for surface changes. The two datasets that made it back it to Earth include a five-color observation from the I27 encounter (February 22, 2000) and a two-frame, clear-filter mosaic from the I32 flyby (October 16, 2001). The first observation, 27ISTVASHT01, has a scale of 315 meters (1,033 feet) per pixel, while the second, 32ISTVASHT01, has a pixel scale of 200 meters (656 feet). Higher resolution imaging was planned for an encounter in August 2001, however they were lost due to a camera anomaly. These included a very high resolution mosaic that would have covered the I25 eruption site and nearby patera wall at 3-5 meters (10-16 feet) per pixel.
The three returned data sets are shown above. Each has been reprojected to an orthographic map projection centered on Tvashtar. The scale is 200 meters (656 feet) per pixel. Finally, the resulting mosaics were cropped so that they cover the same area to make comparisons easier.
Geology
Tvashtar Paterae is not a single volcano, but a chain of four separate volcanic centers. A rough schematic based on the three data sets is shown at right. Orange lines mark the margins of volcanic depressions. Blue lines mark the edges of plateaus, while green lines mark the visible edges of landslide debris deposits. From this image, we can see that Tvashtar can be broken up into roughly two parts. The northern end of Tvashtar consists of a large, 145×105-kilometer (90×65-mile), heart-shaped depression and is located at 64.7° North Latitude, 127.0° West Longitude. This low-depression is host to a large area of dark material, with the darkest of this distributed in a whale-shaped region along the southern and eastern margin of the patera, though an additional very dark region was also seen in the western portion of the patera in July 1999, but had brightened by October 2001. The green color of the rest of the dark terrain of this patera suggest that it consists of older lava or pyroclasts that have been modified chemically by infalling sulfur and sulfur dioxide, creating a film of iron sulfide. High-resolution color observations from I27 revealed a bright deposit along the northeastern wall of this patera, possibly resulting from sulfur dioxide sapping, a geologic process we will encounter often as we explore the geology of Tvashtar, or fumaroles.
The southern end of Tvashtar consists of a 196×70-kilometer (121×44-mile), footprint-shaped region that is almost entirely enclosed by a low, U-shaped plateau named Tvashtar Mensae. This area may be closed off by a patera wall to the northwest as well, but it is not clear if this region is lower than the local Ionian plains. I do not consider this in-and-of-itself a separate volcano. Nested within this region are three smaller paterae, each with signs of recent volcanic activity. Going from west to east, the first nested patera is located at 62.5° North Latitude, 123.2° West Longitude and is 49 by 32 kilometers (30 by 20 miles) in size. A fissure along the northern margin of this volcano was the site of violent volcanic eruptions in November 1999 and February 2007. Lava flows associated with the 1999 eruption, earlier eruptions over the same place (if you look at the July 1999 images) and later eruptions are visible on the patera floor. This patera is surrounded by a dark (occasionally dark green) pyroclastic deposit that reaches out at least 30 kilometers (20 miles) from the edge of the volcano. The area covered by this deposit grows and shrinks in places over the period from 1999-2001, suggesting that volcanic activity leaves behind these deposits in the present epoch and sulfur dioxide released by sapping from the base of Tvashtar Mensae obscures some of it over time.
The second volcano is located at 60.6° North Latitude, 120.4° West Longitude and is 14 by 8 kilometers (9 by 5 miles) in size. This patera is surrounded by digitate lava flows, suggesting that in the past it filled with lava and overflowed onto the surrounding landscape, mostly to its north and east. Finally, the third patera is located at 59.6° North Latitude, 117.9° West Longitude and is 49 by 27 kilometers (9 by 5 miles) in size. Unlike the rest of Tvashtar's constituent paterae, this volcano is bounded by steep cliffs, with a shelf forming a low ledge at its base. This shelf may have formed when some of the lava that once filled the patera to a bit higher up the patera wall than it does today drained back down into the shallow magma reservoir. Through Galileo's February 2000 observations, the southern half of this patera was covered with dark lava, while the northern half was covered with brighter green material, again thought to be chemically-altered basalt.
On-going volcanic activity was detected at all four volcanoes of Tvashtar Paterae at one time or another by Galileo, ground-based telescopes, and New Horizons. This activity will be discussed in later posts this week.
I should also discuss the plateau that surrounds most of Tvashtar Patera. This U-shaped mountain, Tvashtar Mensae, is named after the chain of volcanoes it nearly surrounds. It can be roughly split into eastern and western halves. The eastern half is a smooth, flat plateau that rises approximately 2 kilometers (6,600 feet) above the surrounding plains. The cliffs that run along the edge of this plateau are marked by large alcoves that give it a spur-and-gully pattern. These alcoves grow into large canyons in several spots that penetrate as deep as 40 kilometers (25 miles) into the plateau. These canyons also include small mesas. Running outward from the outer margins of the mesa is a low debris field that is a few hundred meters above the surrounding plains. These morphological characteristics suggest that the mesa has been heavily modified by sulfur dioxide sapping. As I discussed a few days ago, sapping occurs when frozen or liquid sulfur dioxide escapes from the base of a slope on Io and is deposited as a layer of sulfur dioxide frost as much as 70 kilometers (45 miles) away from the cliff. This process can undermine the slope above where the sapping occurred, causing it to collapse and form a gully along the cliff face. Repeated sapping events can cause the slope to retreat. Uneven slope retreat caused by excess sapping in one area, perhaps due to heating from below, can result in the formation of the wide-mouth canyons visible at Tvashtar Mensae and create small mesas, remnant portions of the plateau that have been cut off by sapping and slope retreat, not unlike the one discussed the other day. Sapping and slope retreat can be sped up by heat from sub-surface magma or an interbedded sill. This may be responsible for the U-shape of Tvashtar Mensae, as increased heat flow in the area promotes the removal of material from plateau, eating away at it and forming the eastern half of Tvashtar Paterae. Material that didn't become vaporized during the sapping events and mass wasting events form the hummocky debris deposits to the east and north of Tvashtar Mensae.
The western half of Tvashtar Mensae has a very different morphology. Rather than being flat and smooth, the western half is rougher and rises nearly 6 kilometers (19,700 feet) above the surrounding plains in places. The rough texture of its surface suggests that it has slumped outward since it formed, creating a lobate landslide deposit off the eastern side of the mountain, on the floor of the southern "patera" of Tvashtar Paterae. The 2 kilometer (6,600 feet)-tall cliff that bounds the western edge of the mountain has a regular arcuate margin that is explained more easily by simple mass wasting through slumping and small landslide events, rather than sapping like the eastern half of Tvashtar Mensae. This close connection between a tall mountain, perhaps created by thrust faulting, and a lower smooth mesa has been seen at several other locations across Io, including Zal Montes, where the two components may have broken apart by strike-slip faulting.
The geology of the Tvashtar region is strongly affected by the volcanic activity that occurs there. Galileo, New Horizons, and ground-based telescopes have observed major volcanic eruptions at Tvashtar on several occasions since 1999. Over the next two posts, we will examine the volcanic history of Tvashtar Paterae. Tomorrow, we will focus on the volcanic activity observed at Tvashtar between 1999 and 2001. On Wednesday, we will look at more recent activity in 2006 and 2007, including the incredible volcanic plume seen by New Horizons. I hope you enjoy!
References:
Keszthelyi, L.; et al. (2001). "Imaging of volcanic activity on Jupiter's moon Io by Galileo during the Galileo Europa Mission and the Galileo Millennium Mission". Journal of Geophysical Research 106 (E12): 33,025–33,052.
Radebaugh, J.; et al. (2001). "Paterae on Io: A new type of volcanic caldera?". Journal of Geophysical Research 106 (E12): 33,005–33,020.
Turtle, E.; et al. (2004). "The final Galileo SSI observations of Io: orbits G28-I33". Icarus 169: 3–28.
Milazzo, M.; et al. (2005). "Volcanic activity at Tvashtar Catena, Io". Icarus 179: 235–251.
Moore, J.; et al. (2001). "Landform degradation and slope processes on Io: The Galileo view". Journal of Geophysical Research 106 (E12): 33,223–33,240.
Schenk, P.; et al. (2001). "The mountains of Io: Global and geological perspectives from Voyager and Galileo". Journal of Geophysical Research 106 (E12): 33,201–33,222.
First, let's stick to the basics. Tvashtar Paterae is a chain of volcanic depressions located at 62.76° North Latitude, 123.53° West Longitude, placing it in the high northern latitudes of Io's anti-Jovian (i.e. the "far" side) and leading hemispheres. All together, Tvashtar measures 306 kilometers (190 miles) from its northwest to southeast ends. The volcanic region is named after Tvastar, a solar deity and blacksmith to the gods of the Vedic religion. Tvastar crafted, like Hephaestus for Zeus in Greek mythology, the thunderbolts of Indra and other magical implements. There are a number of Ionian volcanoes named after characters from Vedic and Hindu religious texts, such as Savitr (a large volcanic depression 300 kilometers, or 186 miles, south of Tvashtar), Surya, Vivasvant, Arusha, and Agni. Originally, the region was named Tvashtar Catena in 2000, using the IAU term for a string of craters, but that feature type was deprecated for Io in 2006, so the descriptor term was changed to the plural of patera (technically, an irregular depression, but used for Io as a geologic term for a volcanic depression).
Images
Before we get to the geology of Tvashtar Paterae, let's take a look at the available imagery, which you will see a lot of over the next few days on this blog. While it was clearly visible in global-scale images taken by the Voyagers and Galileo before (including the C21 global color mosaic, a portion of which is shown at the top of this article), Tvashtar was first imaged up-close on November 26, 1999 during Galileo's I25 flyby. This two-frame mosaic, with a scale of 183 meters (600 feet) per pixel, was originally designed as a 2 frame-by-4 frame mosaic that covered both Tvashtar and Savitr Patera to the south. The goal was to better understand the geology of giant paterae (i.e. volcanic depressions) that appeared to be common across Io's polar regions. Based on measurements made by Jani Radebaugh and her colleagues and published in 2001, the paterae at high latitudes are larger but less numerous, and these two large depressions were thought to be typical of this. Their eruption style also seemed to differ from volcanoes observed at lower latitudes. 25ISGIANTS01 was trimmed down to a 2-frame mosaic covering only Tvashtar Paterae in late October 1999 after the I24 flyby when the malfunction of the camera's summation mode meant that fewer frames could be taken given the available downlink. Frames also had to be cut because of the decision to use pre-downlink compression off the tape recorder, rather than the camera's on-board compression, for some of the images taken. The observation was returned slowly during December 1999, revealing a violent new eruption in the Tvashtar region.
As a result of the eruption there, Tvashtar was targeted for imaging on three of Galileo's four remaining Io flybys, in order to look for new activity and to monitor the region for surface changes. The two datasets that made it back it to Earth include a five-color observation from the I27 encounter (February 22, 2000) and a two-frame, clear-filter mosaic from the I32 flyby (October 16, 2001). The first observation, 27ISTVASHT01, has a scale of 315 meters (1,033 feet) per pixel, while the second, 32ISTVASHT01, has a pixel scale of 200 meters (656 feet). Higher resolution imaging was planned for an encounter in August 2001, however they were lost due to a camera anomaly. These included a very high resolution mosaic that would have covered the I25 eruption site and nearby patera wall at 3-5 meters (10-16 feet) per pixel.
| | |
| 25ISGIANTS01 - 11/26/1999 | 27ISTVASHT01 - 02/22/2000 | 32ISTVASHT01 - 10/16/2001 |
Geology
Tvashtar Paterae is not a single volcano, but a chain of four separate volcanic centers. A rough schematic based on the three data sets is shown at right. Orange lines mark the margins of volcanic depressions. Blue lines mark the edges of plateaus, while green lines mark the visible edges of landslide debris deposits. From this image, we can see that Tvashtar can be broken up into roughly two parts. The northern end of Tvashtar consists of a large, 145×105-kilometer (90×65-mile), heart-shaped depression and is located at 64.7° North Latitude, 127.0° West Longitude. This low-depression is host to a large area of dark material, with the darkest of this distributed in a whale-shaped region along the southern and eastern margin of the patera, though an additional very dark region was also seen in the western portion of the patera in July 1999, but had brightened by October 2001. The green color of the rest of the dark terrain of this patera suggest that it consists of older lava or pyroclasts that have been modified chemically by infalling sulfur and sulfur dioxide, creating a film of iron sulfide. High-resolution color observations from I27 revealed a bright deposit along the northeastern wall of this patera, possibly resulting from sulfur dioxide sapping, a geologic process we will encounter often as we explore the geology of Tvashtar, or fumaroles.
The southern end of Tvashtar consists of a 196×70-kilometer (121×44-mile), footprint-shaped region that is almost entirely enclosed by a low, U-shaped plateau named Tvashtar Mensae. This area may be closed off by a patera wall to the northwest as well, but it is not clear if this region is lower than the local Ionian plains. I do not consider this in-and-of-itself a separate volcano. Nested within this region are three smaller paterae, each with signs of recent volcanic activity. Going from west to east, the first nested patera is located at 62.5° North Latitude, 123.2° West Longitude and is 49 by 32 kilometers (30 by 20 miles) in size. A fissure along the northern margin of this volcano was the site of violent volcanic eruptions in November 1999 and February 2007. Lava flows associated with the 1999 eruption, earlier eruptions over the same place (if you look at the July 1999 images) and later eruptions are visible on the patera floor. This patera is surrounded by a dark (occasionally dark green) pyroclastic deposit that reaches out at least 30 kilometers (20 miles) from the edge of the volcano. The area covered by this deposit grows and shrinks in places over the period from 1999-2001, suggesting that volcanic activity leaves behind these deposits in the present epoch and sulfur dioxide released by sapping from the base of Tvashtar Mensae obscures some of it over time.
The second volcano is located at 60.6° North Latitude, 120.4° West Longitude and is 14 by 8 kilometers (9 by 5 miles) in size. This patera is surrounded by digitate lava flows, suggesting that in the past it filled with lava and overflowed onto the surrounding landscape, mostly to its north and east. Finally, the third patera is located at 59.6° North Latitude, 117.9° West Longitude and is 49 by 27 kilometers (9 by 5 miles) in size. Unlike the rest of Tvashtar's constituent paterae, this volcano is bounded by steep cliffs, with a shelf forming a low ledge at its base. This shelf may have formed when some of the lava that once filled the patera to a bit higher up the patera wall than it does today drained back down into the shallow magma reservoir. Through Galileo's February 2000 observations, the southern half of this patera was covered with dark lava, while the northern half was covered with brighter green material, again thought to be chemically-altered basalt.
On-going volcanic activity was detected at all four volcanoes of Tvashtar Paterae at one time or another by Galileo, ground-based telescopes, and New Horizons. This activity will be discussed in later posts this week.
I should also discuss the plateau that surrounds most of Tvashtar Patera. This U-shaped mountain, Tvashtar Mensae, is named after the chain of volcanoes it nearly surrounds. It can be roughly split into eastern and western halves. The eastern half is a smooth, flat plateau that rises approximately 2 kilometers (6,600 feet) above the surrounding plains. The cliffs that run along the edge of this plateau are marked by large alcoves that give it a spur-and-gully pattern. These alcoves grow into large canyons in several spots that penetrate as deep as 40 kilometers (25 miles) into the plateau. These canyons also include small mesas. Running outward from the outer margins of the mesa is a low debris field that is a few hundred meters above the surrounding plains. These morphological characteristics suggest that the mesa has been heavily modified by sulfur dioxide sapping. As I discussed a few days ago, sapping occurs when frozen or liquid sulfur dioxide escapes from the base of a slope on Io and is deposited as a layer of sulfur dioxide frost as much as 70 kilometers (45 miles) away from the cliff. This process can undermine the slope above where the sapping occurred, causing it to collapse and form a gully along the cliff face. Repeated sapping events can cause the slope to retreat. Uneven slope retreat caused by excess sapping in one area, perhaps due to heating from below, can result in the formation of the wide-mouth canyons visible at Tvashtar Mensae and create small mesas, remnant portions of the plateau that have been cut off by sapping and slope retreat, not unlike the one discussed the other day. Sapping and slope retreat can be sped up by heat from sub-surface magma or an interbedded sill. This may be responsible for the U-shape of Tvashtar Mensae, as increased heat flow in the area promotes the removal of material from plateau, eating away at it and forming the eastern half of Tvashtar Paterae. Material that didn't become vaporized during the sapping events and mass wasting events form the hummocky debris deposits to the east and north of Tvashtar Mensae.
The western half of Tvashtar Mensae has a very different morphology. Rather than being flat and smooth, the western half is rougher and rises nearly 6 kilometers (19,700 feet) above the surrounding plains in places. The rough texture of its surface suggests that it has slumped outward since it formed, creating a lobate landslide deposit off the eastern side of the mountain, on the floor of the southern "patera" of Tvashtar Paterae. The 2 kilometer (6,600 feet)-tall cliff that bounds the western edge of the mountain has a regular arcuate margin that is explained more easily by simple mass wasting through slumping and small landslide events, rather than sapping like the eastern half of Tvashtar Mensae. This close connection between a tall mountain, perhaps created by thrust faulting, and a lower smooth mesa has been seen at several other locations across Io, including Zal Montes, where the two components may have broken apart by strike-slip faulting.
The geology of the Tvashtar region is strongly affected by the volcanic activity that occurs there. Galileo, New Horizons, and ground-based telescopes have observed major volcanic eruptions at Tvashtar on several occasions since 1999. Over the next two posts, we will examine the volcanic history of Tvashtar Paterae. Tomorrow, we will focus on the volcanic activity observed at Tvashtar between 1999 and 2001. On Wednesday, we will look at more recent activity in 2006 and 2007, including the incredible volcanic plume seen by New Horizons. I hope you enjoy!
References:
Keszthelyi, L.; et al. (2001). "Imaging of volcanic activity on Jupiter's moon Io by Galileo during the Galileo Europa Mission and the Galileo Millennium Mission". Journal of Geophysical Research 106 (E12): 33,025–33,052.
Radebaugh, J.; et al. (2001). "Paterae on Io: A new type of volcanic caldera?". Journal of Geophysical Research 106 (E12): 33,005–33,020.
Turtle, E.; et al. (2004). "The final Galileo SSI observations of Io: orbits G28-I33". Icarus 169: 3–28.
Milazzo, M.; et al. (2005). "Volcanic activity at Tvashtar Catena, Io". Icarus 179: 235–251.
Moore, J.; et al. (2001). "Landform degradation and slope processes on Io: The Galileo view". Journal of Geophysical Research 106 (E12): 33,223–33,240.
Schenk, P.; et al. (2001). "The mountains of Io: Global and geological perspectives from Voyager and Galileo". Journal of Geophysical Research 106 (E12): 33,201–33,222.
Filed Under:
Galileo,
Geology,
Reprocessing,
Tvashtar,
Volcanism
Friday, August 27, 2010
High-Resolution Mystery in Bulicame Regio on Io
On February 22, 2000, Galileo flew close to Io for its 4th targeted flyby of the satellite with a altitude of 198 kilometers (a flyby known as I27). Right at closest approach, Galileo turned its suite of remote sensing instruments at the southeastern edge of a low plateau east of the active volcano Isum Patera, on the southern end of Bulicame Regio. The camera was pointed significantly off nadir and was instead looking much closer to the local horizon at an emission angle (an angular measure of how far a point on the surface is from nadir: looking straight down is 0° and looking at the horizon is 90°) was The observation, 25ISSAPPNG01, was designed to look for evidence of sapping and other slope degradation processes on the margin of this plateau. Sapping, a geologic process by which sulfur dioxide in gas or liquid form escapes from a mountain slope, undermining the slopes strength and causing it to downslope movement. Four images were planned for this observation and three were eventually played back, though only 2/3rds of the lines of each frame (525 out of 800) were played back due to the limited amount of downlink available since the camera and spacecraft worked perfectly during this encounter, in contrast to the camera and spectrometer anomalies experienced during I24 and the spacecraft safing event on I25 that led to loss of data. However, in the 10 years since these images were sent back from Galileo, they have become a bit of a mystery for planetary scientists, as interpreting the geology of the terrain seen in the images of 25ISSAPPNG01 has been difficult.
I, for the bazillionth time I swear, have processed the data into a mosaic that you can see above, though you can check out a full-resolution version here. Like my version of the Chaac Patera mosaic taken a few minutes later, the images have been reprojected into a point-perspective map projection. This approximates the view Galileo had at the time. North is just to the left of up in this mosaic, as it has been rotated so north is up. The perspective is from the point when the middle image was acquired (though I had to adjust the center latitude and longitude to eliminate distortions in the middle image, compared to the sub-spacecraft point reported in the PDS). Since Galileo was moving rapidly over Io's surface during the observation, the first and third images are a bit distorted compared to the original data in order to match the perspective of the second, with the first images becoming stretched and the third becoming squished. However, the distortion is not so bad that we can't examine the features seen in the images.
The first problem we face however in interpreting the surface features seen in this mosaic is that we lack proper context. The images in this mosaic have an effective resolution of approximately 11.6 meters per pixel when you take into account that we are looking toward the horizon rather than straight down at Io. This more than two orders of a magnitude better than the next best data over this area, shown at left. This is a clear filter mosaic from October 1999, blown up about three times its original size. With such a disparity in resolution between the two observations, it becomes difficult to correlate structures seen in both since each of the three I27 frames are 6 pixels across in the I24 data. The other complication this disparity presents is that we can't tell exactly where the I27 images are in the I24 data. The pointing was more than a entire SSI field-of-view off from the planned pointing. From there we can only correct the pointing relative to each other, rather than to any basemap since the next best data doesn't even show the scale of features we seen in the I27 images.
Basically, we don't know how the features relate to the regional geologic context. We know some basics. We know that the region we are looking at is a few kilometers southeast of the base of a scarp that bounds a low mesa. In lower resolution images, this area appears to be a patch work of bright and dark material on the edge of the scarp, perhaps the result of sulfur dioxide-modified lava flows. At that scale, this imaged area was mapped as bright flows by Williams et al. 2010. Finally, we also know that there has been recent volcanic activity in this area.
Let's take a look at the features we can observe in this mosaic. The most prominent feature is a 400-meter-tall mesa at the bottom of the middle frame. There doesn't appear to be much evidence for layering along the scarp face of this mesa, except for a 50-meter-thick cap rock. Surrounding the mesa is a low plain marked by swirls of bright and dark terrain. Beyond that is region of smoother dark terrain that is marked by large boulders and narrow channels. Finally, beyond that in the third frame, there is a region of bright and dark layered terrain.
This is certainly quite an enigmatic landscape. One interpretation provided by Moore et al. 2001 suggests that the mesa was once much larger, but over time sapping has undermined the edge of the mesa, causing it to shrink. The mottled terrain that surrounds the mesa, filled with bright and dark swirls maybe the area the mesa retreated from. However, note that this is not the main plateau, which is to the north west of the area covered in these images, and that the mesa seen in the high-res data was not seen in the lower resolution images, suggesting that it isn't much bigger than the what we see here. I don't think this necessarily changes the story. On Earth, headward sapping erosion of plateaus have been known to cause portions to be cut off, forming small mesas. The bright and dark swirls may result from sulfur dioxide filling low areas as it flowed out from the base of the cliff and from fumaroles with the adjacent dark terrain (seen in the middle frame). Like the water in the gullies on Mars, the sulfur dioxide is boiling as it flows across Io's surface, either escaping to the atmosphere as a gas or freezing as a bright frost in low regions. The bright/dark mottled terrain appears to follow the shape of the mesa, further suggesting that it is the result of scarp retreat. As for where the material that made up this scarp went, it is thought that the upper 1-2 kilometers of Io's crust is made up largely of sulfur and sulfur dioxide with cooled silicate existing as layers in the near-surface. This scarp, and others like it, may then retreat more akin to the polar ice caps on Mars than mesas on Earth, leaving behind only a trace amount of talus near the slope.
Alternatively, the features seen here could be explained by volcanic processes. After all, this area was mapped as a bright flow from global-scale images. One of the reasons I wanted to write up this article is that the bright/dark patchwork landscape bears a resemblance to other sulfur-modified lava flow fields seen on the floor of Chaac Patera and to the southeast of Emakong Patera, the latter of which I discussed a couple of weeks ago. This mottled terrain result again from a similar process as I discussed above: fumaroles on the surface of a cooling lava flow bring up liquid sulfur dioxide where it then freezes in low areas of the flow surface. However, there don't seem to be any indications of flow lobes in this areas, which you would expect to see if this were once a compound flow field. This terrain also hugs the base of the mesa, which would you would not normally see since the base of the cliff should be higher topographically that the surrounding plains. However, the irregular pattern of the mottled terrain at the base of the mesa and the fracture that runs across the middle frame could be the result of the interaction between hot silicate lava and volatile sulfur dioxide.
In February 2000, Galileo imaged a very enigmatic landscape at high resolution. The terrain seen in these images has been difficult to interpret due to the lack of proper context imaging of this region. The difficulty in interpreting this data forced a change in the imaging strategy for later flybys as super high-resolution observations were dropped and other sequences with resolutions similar to this mosaic were accompanied by lower-resolution images taken at later in the encounters to help interpret small-scale features. However, this lack of regional context doesn't make the features seen here any more interesting or make us less capable to at least speculate as to what caused this mess, whether it was erosion from sulfur dioxide sapping, volcanic lava flows, or fumaroles leaving behind frozen sulfur dioxide.
References:
Turtle, E. P.; et al. (2001). "Mountains on Io: High-resolution Galileo observations, initial interpretations, and formation models". Journal of Geophysical Research 106 (E12): 33175–33199.
Moore, J.; et al. (2001). "Landform degradation and slope processes on Io: The Galileo view". Journal of Geophysical Research 106 (E12): 33223–33240.
I, for the bazillionth time I swear, have processed the data into a mosaic that you can see above, though you can check out a full-resolution version here. Like my version of the Chaac Patera mosaic taken a few minutes later, the images have been reprojected into a point-perspective map projection. This approximates the view Galileo had at the time. North is just to the left of up in this mosaic, as it has been rotated so north is up. The perspective is from the point when the middle image was acquired (though I had to adjust the center latitude and longitude to eliminate distortions in the middle image, compared to the sub-spacecraft point reported in the PDS). Since Galileo was moving rapidly over Io's surface during the observation, the first and third images are a bit distorted compared to the original data in order to match the perspective of the second, with the first images becoming stretched and the third becoming squished. However, the distortion is not so bad that we can't examine the features seen in the images.
The first problem we face however in interpreting the surface features seen in this mosaic is that we lack proper context. The images in this mosaic have an effective resolution of approximately 11.6 meters per pixel when you take into account that we are looking toward the horizon rather than straight down at Io. This more than two orders of a magnitude better than the next best data over this area, shown at left. This is a clear filter mosaic from October 1999, blown up about three times its original size. With such a disparity in resolution between the two observations, it becomes difficult to correlate structures seen in both since each of the three I27 frames are 6 pixels across in the I24 data. The other complication this disparity presents is that we can't tell exactly where the I27 images are in the I24 data. The pointing was more than a entire SSI field-of-view off from the planned pointing. From there we can only correct the pointing relative to each other, rather than to any basemap since the next best data doesn't even show the scale of features we seen in the I27 images.
Basically, we don't know how the features relate to the regional geologic context. We know some basics. We know that the region we are looking at is a few kilometers southeast of the base of a scarp that bounds a low mesa. In lower resolution images, this area appears to be a patch work of bright and dark material on the edge of the scarp, perhaps the result of sulfur dioxide-modified lava flows. At that scale, this imaged area was mapped as bright flows by Williams et al. 2010. Finally, we also know that there has been recent volcanic activity in this area.
Let's take a look at the features we can observe in this mosaic. The most prominent feature is a 400-meter-tall mesa at the bottom of the middle frame. There doesn't appear to be much evidence for layering along the scarp face of this mesa, except for a 50-meter-thick cap rock. Surrounding the mesa is a low plain marked by swirls of bright and dark terrain. Beyond that is region of smoother dark terrain that is marked by large boulders and narrow channels. Finally, beyond that in the third frame, there is a region of bright and dark layered terrain.
This is certainly quite an enigmatic landscape. One interpretation provided by Moore et al. 2001 suggests that the mesa was once much larger, but over time sapping has undermined the edge of the mesa, causing it to shrink. The mottled terrain that surrounds the mesa, filled with bright and dark swirls maybe the area the mesa retreated from. However, note that this is not the main plateau, which is to the north west of the area covered in these images, and that the mesa seen in the high-res data was not seen in the lower resolution images, suggesting that it isn't much bigger than the what we see here. I don't think this necessarily changes the story. On Earth, headward sapping erosion of plateaus have been known to cause portions to be cut off, forming small mesas. The bright and dark swirls may result from sulfur dioxide filling low areas as it flowed out from the base of the cliff and from fumaroles with the adjacent dark terrain (seen in the middle frame). Like the water in the gullies on Mars, the sulfur dioxide is boiling as it flows across Io's surface, either escaping to the atmosphere as a gas or freezing as a bright frost in low regions. The bright/dark mottled terrain appears to follow the shape of the mesa, further suggesting that it is the result of scarp retreat. As for where the material that made up this scarp went, it is thought that the upper 1-2 kilometers of Io's crust is made up largely of sulfur and sulfur dioxide with cooled silicate existing as layers in the near-surface. This scarp, and others like it, may then retreat more akin to the polar ice caps on Mars than mesas on Earth, leaving behind only a trace amount of talus near the slope.
Alternatively, the features seen here could be explained by volcanic processes. After all, this area was mapped as a bright flow from global-scale images. One of the reasons I wanted to write up this article is that the bright/dark patchwork landscape bears a resemblance to other sulfur-modified lava flow fields seen on the floor of Chaac Patera and to the southeast of Emakong Patera, the latter of which I discussed a couple of weeks ago. This mottled terrain result again from a similar process as I discussed above: fumaroles on the surface of a cooling lava flow bring up liquid sulfur dioxide where it then freezes in low areas of the flow surface. However, there don't seem to be any indications of flow lobes in this areas, which you would expect to see if this were once a compound flow field. This terrain also hugs the base of the mesa, which would you would not normally see since the base of the cliff should be higher topographically that the surrounding plains. However, the irregular pattern of the mottled terrain at the base of the mesa and the fracture that runs across the middle frame could be the result of the interaction between hot silicate lava and volatile sulfur dioxide.
In February 2000, Galileo imaged a very enigmatic landscape at high resolution. The terrain seen in these images has been difficult to interpret due to the lack of proper context imaging of this region. The difficulty in interpreting this data forced a change in the imaging strategy for later flybys as super high-resolution observations were dropped and other sequences with resolutions similar to this mosaic were accompanied by lower-resolution images taken at later in the encounters to help interpret small-scale features. However, this lack of regional context doesn't make the features seen here any more interesting or make us less capable to at least speculate as to what caused this mess, whether it was erosion from sulfur dioxide sapping, volcanic lava flows, or fumaroles leaving behind frozen sulfur dioxide.
References:
Turtle, E. P.; et al. (2001). "Mountains on Io: High-resolution Galileo observations, initial interpretations, and formation models". Journal of Geophysical Research 106 (E12): 33175–33199.
Moore, J.; et al. (2001). "Landform degradation and slope processes on Io: The Galileo view". Journal of Geophysical Research 106 (E12): 33223–33240.
Wednesday, August 25, 2010
Io Volcano of the Week: Culann
This month for my Io Volcano of the Week series, we are looking at volcanoes that were observed at moderate resolution (160-280 meters or 525-920 feet per pixel) during Galileo's I25 flyby of Io on November 26, 1999. Over the last three weeks we have looked at Zal, Emakong, and Hi'iaka, three large paterae - volcanic depressions - on Io's leading hemisphere. This week we take a look at Culann Patera. Like Emakong, the green-colored patera is surrounded by a number of distinct lava flows of varying surface colors and ages. The most recent of these flow lobes formed between 1979 and 1996, along with a number of other changes at Culann between how it appeared during the Voyager flybys and the Galileo mission. Unlike Emakong, lava temperatures measured at Culann by the Galileo spacecraft are clearly in the silicate range, suggesting that the colored lava flows are a surface coating after they had cooled, rather than the result of sulfur volcanism. It is also the site of a faint, dust-poor plume, observed by Galileo in 1998, though a fairly distinctive plume deposit was seen by the spacecraft.
Culann Patera was first observed in Voyager 1 images. It is located 600 kilometers (375 miles) south-southwest of the active volcano Prometheus at 20.2° South, 160.2° West. The spacecraft observed dark lava flows surrounding the small patera (not seen by Voyager due to the low resolution) with a narrow flow lobe extending out to the northwest of the main flow field before turning west. The darkest of the flows seen by the Voyagers was to the southwest of the patera that was later seen by Galileo. The volcano was named by the IAU in 1979 after a blacksmith from the Ulster cycle of Irish mythology.
Culann was next observed by Galileo 17 years later. Its first images of the region were taken in September 1996, revealing a number of changes as a result of volcanic activity in years between observations including fresh silicate lava flows and a reddish plume deposit. Many of the flows that were dark in 1979, suggesting they were active at the time, had brightened by September 1996, meaning they had cooled enough to permit sulfur and sulfur dioxide to condense on them. NIMS detected a thermal hotspot at Culann during this encounter and through 75% of the observations of this region during the nominal mission, showing that the volcano remained active throughout the Galileo mission. A small, faint plume may have been detected in September 1996 (which could have been the source of the new reddish deposits at Culann), along with a gas plume seen while Io was in Jupiter's shadow in May 1998.
Details on the style of volcanic activity at Culann would come during Galileo's flybys of Io in late 1999 and 2001. Lower resolution color data from throughout the Galileo mission showed that Culann Patera was host to a variety of colored terrains, with green, red, and yellow colored lava flows and plains in close proximity. As a result, the imaging team targeted the volcano for a medium resolution, two-by-two frame, color mosaic during Galileo I25 encounter on November 26, 1999. I've processed the images that were returned into the three mosaics below. All three use orthographic projection with a scale of 206.3 meters (676.8 feet) per pixel. The first is a mosaic of the red, green, and violet frames returned from the 25ISCULANN01 observation [high-resolution version available]. Only those areas covered by all three colors are included. The second mosaic covers the same area as the first, but the blue channel uses a synthetic blue filter image created using the method I described last week [high-resolution version available]. The third mosaic includes the area from the first mosaic, but includes the rest of the green filter data from the 25ISCULANN01 observation [high-resolution version available]. This additional data was colorized using data acquired in July 1999.
These images revealed that Culann Patera was a shallow, green floored depression, seven kilometers (4.3 miles) by 23 kilometers (14.3 miles) in size. Both the patera and the region surrounding it (particularly to the south and east) are coated with green material, and this greenish terrain is in turn surrounded by a 150- to-170-kilometer-diameter (93 to 106 mile) ring of red deposits (that was a bit more distinctive to the east of Culann Patera earlier in the Galileo mission). Many of these deposits coat an overlapping set of lava flows that radiate out from the patera. A curved, dark red line runs for 42 kilometers (26 miles) from the southwest end of the patera toward the northwest, growing fainter the farther northwest it goes. It terminates in the proximal end of Culann's darkest and youngest lava flow fields, which run another 75 kilometers (47 miles) to the north west. Multi-colored, older lava flows are seen to the southeast of Culann Patera. These correspond to the darkest flows seen by the Voyager spacecraft in 1979. These lava had flowed into a shallow depression that is surrounded by low, etched mesas.
Comparing these images to a regional mapping observation taken in October 2001 reveal a number of changes within this dark flow field, suggesting that like Prometheus, it is a compound flow field that is built up by fresh, darker breakouts of lava. One suggestion provided by Keszthelyi et al. 2001 is that the curved, red line seen running northwest of the patera is a lava tube that brings lava from the source at the patera to the flow field. The reddish material that marks the location of this lava tube may result from sulfurous gases escape through skylights on the roof of the lava tube that then condense on the colder plains nearby. Lava flows through this lava tube from its source at Culann Patera to the lava flow field, where it spills out into first small breakouts in the medial portion of the dark flow field, then larger areas of warm, dark lava toward the distal end of the field. This idea is supported by high resolution near-infrared spectrometer data, which revealed two hot spots within the Culann volcanic system. The brightest hotspot is located over the dark flow field due its large exposures of recent lava. A smaller thermal hotspot is located at Culann Patera, the source of the lava flows in this region. The long length of the flows radiating out from it suggest that the lavas they are composed of had a very low viscosity, as there is very little difference in altitude between the margins of Culann Patera and the surrounding plains, based on stereo images by Galileo.
The colors seen at Culann are thought to be result of the interaction between sulfur and silicate lava. When sulfur, emitted from the source vent at the patera or from the main active lava tube, condenses and lands on the surface, it normally creates a reddish deposit on the surface. The size of the deposit is the result of the temperature of the escaping gases and the vent pressure. Given the size of the red deposit at Culann, both factors are likely to be less than at Pele, which has a red ring plume deposit more than a 1,000 kilometers (600 miles) across. When this sulfur condenses on Io's cold plains (~120 K/-244° F), this produces a red deposit. When it lands on warm lava, the sulfur is thought to interact chemically with the iron in Io's lavas to produce greenish iron sulfide, or pyrite as it is known in its mineral form. A few bright white spots are seen along portions of the current flow field to the northwest of Culann Patera. These result from the interaction between cold sulfur dioxide frost on Io's surface and hot, silicate lava that flows over it. The lava vaporizes the frost, which then condenses on the cold ground outside the flow field, or on older, colder areas of the flow field (gradually brightening the flow as it ages as more SO2 frost and sulfur is deposited on it).
The color observation of Culann Patera in November 1999 allowed researchers to examine the relationship between different color units seen all across Io's surface. They revealed a complex interaction between sulfurous gases, emitted either from the primary vent or from re-volatilization by flowing lavas, and the terrain these gases land on. They also provided further evidence for how large lava flow fields develop, an idea that seems to be back up at other sites like Prometheus and Amirani.
Next week, we will take a look at the target of Galileo's 25ISGIANTS01 observation, Tvashtar Paterae.
References:
Williams, D.; et al. (2004). "Mapping of the Culann–Tohil region of Io from Galileo imaging data". Icarus 169: 80–97.
Geissler, P. E., M.T. McMillan. (2008). "Galileo observations of volcanic plumes on Io". Icarus 197: 505–518.
Lopes-Gautier, R.; et al. (1999). "Active Volcanism on Io: Global Distribution and Variations in Activity". Icarus 140: 243–264.
Keszthelyi, L.; et al. (2001). "Imaging of volcanic activity on Jupiter's moon Io by Galileo during the Galileo Europa Mission and the Galileo Millennium Mission". Journal of Geophysical Research 106 (E12): 33,025–33,052.
Culann Patera was first observed in Voyager 1 images. It is located 600 kilometers (375 miles) south-southwest of the active volcano Prometheus at 20.2° South, 160.2° West. The spacecraft observed dark lava flows surrounding the small patera (not seen by Voyager due to the low resolution) with a narrow flow lobe extending out to the northwest of the main flow field before turning west. The darkest of the flows seen by the Voyagers was to the southwest of the patera that was later seen by Galileo. The volcano was named by the IAU in 1979 after a blacksmith from the Ulster cycle of Irish mythology.
Culann was next observed by Galileo 17 years later. Its first images of the region were taken in September 1996, revealing a number of changes as a result of volcanic activity in years between observations including fresh silicate lava flows and a reddish plume deposit. Many of the flows that were dark in 1979, suggesting they were active at the time, had brightened by September 1996, meaning they had cooled enough to permit sulfur and sulfur dioxide to condense on them. NIMS detected a thermal hotspot at Culann during this encounter and through 75% of the observations of this region during the nominal mission, showing that the volcano remained active throughout the Galileo mission. A small, faint plume may have been detected in September 1996 (which could have been the source of the new reddish deposits at Culann), along with a gas plume seen while Io was in Jupiter's shadow in May 1998.
Details on the style of volcanic activity at Culann would come during Galileo's flybys of Io in late 1999 and 2001. Lower resolution color data from throughout the Galileo mission showed that Culann Patera was host to a variety of colored terrains, with green, red, and yellow colored lava flows and plains in close proximity. As a result, the imaging team targeted the volcano for a medium resolution, two-by-two frame, color mosaic during Galileo I25 encounter on November 26, 1999. I've processed the images that were returned into the three mosaics below. All three use orthographic projection with a scale of 206.3 meters (676.8 feet) per pixel. The first is a mosaic of the red, green, and violet frames returned from the 25ISCULANN01 observation [high-resolution version available]. Only those areas covered by all three colors are included. The second mosaic covers the same area as the first, but the blue channel uses a synthetic blue filter image created using the method I described last week [high-resolution version available]. The third mosaic includes the area from the first mosaic, but includes the rest of the green filter data from the 25ISCULANN01 observation [high-resolution version available]. This additional data was colorized using data acquired in July 1999.
These images revealed that Culann Patera was a shallow, green floored depression, seven kilometers (4.3 miles) by 23 kilometers (14.3 miles) in size. Both the patera and the region surrounding it (particularly to the south and east) are coated with green material, and this greenish terrain is in turn surrounded by a 150- to-170-kilometer-diameter (93 to 106 mile) ring of red deposits (that was a bit more distinctive to the east of Culann Patera earlier in the Galileo mission). Many of these deposits coat an overlapping set of lava flows that radiate out from the patera. A curved, dark red line runs for 42 kilometers (26 miles) from the southwest end of the patera toward the northwest, growing fainter the farther northwest it goes. It terminates in the proximal end of Culann's darkest and youngest lava flow fields, which run another 75 kilometers (47 miles) to the north west. Multi-colored, older lava flows are seen to the southeast of Culann Patera. These correspond to the darkest flows seen by the Voyager spacecraft in 1979. These lava had flowed into a shallow depression that is surrounded by low, etched mesas.
Comparing these images to a regional mapping observation taken in October 2001 reveal a number of changes within this dark flow field, suggesting that like Prometheus, it is a compound flow field that is built up by fresh, darker breakouts of lava. One suggestion provided by Keszthelyi et al. 2001 is that the curved, red line seen running northwest of the patera is a lava tube that brings lava from the source at the patera to the flow field. The reddish material that marks the location of this lava tube may result from sulfurous gases escape through skylights on the roof of the lava tube that then condense on the colder plains nearby. Lava flows through this lava tube from its source at Culann Patera to the lava flow field, where it spills out into first small breakouts in the medial portion of the dark flow field, then larger areas of warm, dark lava toward the distal end of the field. This idea is supported by high resolution near-infrared spectrometer data, which revealed two hot spots within the Culann volcanic system. The brightest hotspot is located over the dark flow field due its large exposures of recent lava. A smaller thermal hotspot is located at Culann Patera, the source of the lava flows in this region. The long length of the flows radiating out from it suggest that the lavas they are composed of had a very low viscosity, as there is very little difference in altitude between the margins of Culann Patera and the surrounding plains, based on stereo images by Galileo.
The colors seen at Culann are thought to be result of the interaction between sulfur and silicate lava. When sulfur, emitted from the source vent at the patera or from the main active lava tube, condenses and lands on the surface, it normally creates a reddish deposit on the surface. The size of the deposit is the result of the temperature of the escaping gases and the vent pressure. Given the size of the red deposit at Culann, both factors are likely to be less than at Pele, which has a red ring plume deposit more than a 1,000 kilometers (600 miles) across. When this sulfur condenses on Io's cold plains (~120 K/-244° F), this produces a red deposit. When it lands on warm lava, the sulfur is thought to interact chemically with the iron in Io's lavas to produce greenish iron sulfide, or pyrite as it is known in its mineral form. A few bright white spots are seen along portions of the current flow field to the northwest of Culann Patera. These result from the interaction between cold sulfur dioxide frost on Io's surface and hot, silicate lava that flows over it. The lava vaporizes the frost, which then condenses on the cold ground outside the flow field, or on older, colder areas of the flow field (gradually brightening the flow as it ages as more SO2 frost and sulfur is deposited on it).
The color observation of Culann Patera in November 1999 allowed researchers to examine the relationship between different color units seen all across Io's surface. They revealed a complex interaction between sulfurous gases, emitted either from the primary vent or from re-volatilization by flowing lavas, and the terrain these gases land on. They also provided further evidence for how large lava flow fields develop, an idea that seems to be back up at other sites like Prometheus and Amirani.
Next week, we will take a look at the target of Galileo's 25ISGIANTS01 observation, Tvashtar Paterae.
References:
Williams, D.; et al. (2004). "Mapping of the Culann–Tohil region of Io from Galileo imaging data". Icarus 169: 80–97.
Geissler, P. E., M.T. McMillan. (2008). "Galileo observations of volcanic plumes on Io". Icarus 197: 505–518.
Lopes-Gautier, R.; et al. (1999). "Active Volcanism on Io: Global Distribution and Variations in Activity". Icarus 140: 243–264.
Keszthelyi, L.; et al. (2001). "Imaging of volcanic activity on Jupiter's moon Io by Galileo during the Galileo Europa Mission and the Galileo Millennium Mission". Journal of Geophysical Research 106 (E12): 33,025–33,052.
Subscribe to:
Posts (Atom)