Showing posts with label Models. Show all posts

Saturday, March 6, 2010

Paper: Mapping Io's Atmosphere with the Submillimeter Array

Another day, another Io atmosphere paper.  Today, we take a look at a paper by Arielle Moullet, Mark A. Gurwell, Emmanuel Lellouch, and Raphaël Moreno titled, "Simultaneous mapping of SO2, SO, NaCl in Io’s atmosphere with the Submillimeter Array." This paper was posted online Thursday in the Papers in Press section of the journal Icarus.  In press papers are articles which have gone through peer review, were revised, and have been approved for publication, but have not been published in the print journal yet.  This paper discusses results from sub-millimeter wavelength observations of Io's leading and trailing hemisphere.  Using these observations, the authors were able to map the distribution of three chemical species in Io's atmosphere, sulfur dioxide (SO2), sulfur monoxide (SO), and sodium chloride (NaCl).  The authors then used these maps and the intensity of the observed emission lines to model the sources for these atmospheric components.  For additional information beyond this summary, check out Moullet's presentation from the Harvard-Smithsonian Center for Astrophysics SMA Science Symposium 2009.

Io has a very thin atmosphere (1-10 nanobars at the surface) composed mostly of sulfur dioxide, along with its disassociation products, sulfur monoxide and atomic sulfur and oxygen.  Other gases observed in Io's atmosphere or thought to exist in Io's atmosphere include sodium chloride, potassium chloride (KCl), diatomic sulfur (S2), and sulfuryl chloride (Cl2SO2).  Io's atmosphere has significant density variations with time of day, being densest near the sub-solar point and thinnest on its night side, and with position on the surface.  The distribution of SO2 gas was mapped across Io's surface using Hubble ultraviolet images of Io at the hydrogen Lyman-α line by Feaga et al. 2009, finding Io's sulfur dioxide gas in the atmosphere to be densest within 40 degrees of latitude from the equator and on Io's anti-Jupiter hemisphere.  Adaptive optics observations at Keck in 2002 showed SO gas at several volcanic centers, which de Pater et al. 2007 suggested was related to volcanic activity.  One of major questions these observations are trying to answer include identifying the dominant source of Io's atmosphere, whether it is sublimation of surface frosts, as atmospheric sulfur dioxide is thought to be in vapor-pressure equilibrium with the surface, or direct volcanic outgassing.

In this new paper, Moullet et al. 2010, the authors used observations taken at the Submillimeter Array (SMA) atop Mauna Kea in Hawaii, a set of eight, 6-meter-wide radio antennas acting as a radio interferometer.  The system observes at millimeter and sub-millimeter wavelengths between 0.3 and 1.7 millimeters (or frequencies between 180 and 700 GHz), at between the infrared and microwave portions of the electromagnetic spectrum.  For these observations, Moullet et al. observed Io in June 2006 and July 2008 at 338 and 346 GHz, at emission bands for sulfur dioxide, sulfur monoxide, and sodium chloride.  These observations were disk-resolved, allowing the authors to examine the hemispherical distribution of each gas species, and in the case of SO2 and SO, the high spectral resolution and signal-to-noise ratio allowed for more detailed analysis of their total emission.

For SO2, Moullet et al.'s SMA data at 346.523 and 346.652 GHz is consistent with the results from Fegea et al.'s Lyman-α data and Spencer et al. 2005's infrared data, further indicating that the sulfur dioxide in Io's atmosphere is predominantly located at equatorial latitudes and Io's anti-Jovian hemisphere.  Both constraints on the distribution of SO2 are similar to the distribution of sulfur dioxide frost on Io's surface and volcanic plumes.  To see which source of SO2 dominates, volcanic outgassing or sublimation of surface frosts, the authors modeled the appearance of Io's 346.652 GHz SO2 line emission using a hydrostatic model of Io's sublimation atmosphere and another modeling emission purely from the volcanic plumes noted by Geissler et al. 2004.  Using an appropriate number of active plumes, the authors found that volcanism does not match the distribution and shape of SO2 gas seen in the SMA data (except for the slight northward offset in emission seen over the anti-Jovian hemisphere in 2006).  In addition, to match the amount of emission observed, an unrealistic number of active volcanic plumes (40-230 Prometheus-type, or 5-20 Pele-type plumes, on each hemisphere) would be required.  Even if all 16 plumes noted by Geissler et al. were active, they would still only account for 5-11% of the emission on the leading side, and 13-18% on the trailing side.  The hydrostatic models of the frost sublimation component of Io's SO2 atmosphere better match the distribution and emission flux seen in the SMA data. The derived SO2 column densities (an average of 2.3-4.6×1016 cm−2 for the leading hemisphere, and 0.7-1.1×1016 cm−2 for the trailing side), gas temperatures, and variations with Io's distance from the Sun provide further evidence that the main source for sulfur dioxide, the dominant component in the satellite's atmosphere, is vapor-pressure equilibrium sublimation of SO2 surface frosts.  A minor fraction of the SO2 also comes from volcanic gas plumes (though not all gas emissions for volcanoes form plumes).

Moullet et al. also mapped the distribution of sulfur monoxide and sodium chloride in Io's atmosphere for the first time.  Both gases were predominately found on Io's anti-Jupiter hemisphere, as SO2 was.  The signal-to-noise ratio for the SO data was sufficient for the authors to perform an analysis on the source of that gas, similar to the one they performed on sulfur dioxide. Two sources were considered: photolysis of SO2, when sulfur dioxide is broken up by solar ultraviolet photons into SO and O, and direct volcanic emission.  In the case of volcanic activity, they found that, using a reasonable level of plume activity, volcanism is the source of 2.5% of the SO observed in the SMA data, using a model that included four volcanic plumes.  Using more plumes, or Pele plumes, would result in models that was more extended spatially than the emission maps from the data acquired.  Even using a favorable, 16 plume model, volcanic plumes account for 13-40% of the total SO emission, assuming a 10% mixing fraction in the plumes.  This at least suggests though, that volcanism is a more significant source of sulfur monoxide than sulfur dioxide.  The dominant source, however, is photolysis from SO2, as the modeling performed by Moullet et al. suggests.  The authors note that the "relative contribution is not easy to assess in the absence of precise estimates on SO lifetime in the atmosphere."

The signal-to-noise ratios of the NaCl maps were much lower than those for the SO2 and SO data, but radiative transfer modeling of NaCl in Io's atmosphere shows that the data is consistent with a volcanic origin. This is particularly the case since NaCl has a short lifetime in Io's atmosphere due loss from condensation on dust particles and photolysis into atomic sodium and chloride.  The amount of NaCl emission observed is consistent with a lower-bound, mixing ratio in volcanic plumes of 0.6% on the trailing hemisphere, and 2.5% on the leading side, similar to thermochemical modeling done by Fegley and Zolotov 2000.  Moullet et al. could not rule out other sources for the NaCl emission, such as sputtering.

This paper seems to provide further evidence that most of the gases in Io's atmosphere result from the sublimation of sulfur dioxide surface frosts, with direct volcanic emission playing a minor role.  Other major atmospheric components such as sulfur, oxygen, and sulfur monoxide result from the photo-disassocation of sulfur dioxide into its elemental components by solar ultraviolet photons, though a larger percentage of the sulfur monoxide in the atmosphere may come from direct volcanic outgassing.  Finally, some atmospheric components not related to sulfur chemistry, such as sodium chloride, could be entirely explained by volcanic outgassing, though other sources such as sputtering are also possible, but weren't modeled by the authors as the distribution of surface deposits of minerals other than sulfur and sulfur dioxide are very poorly constrained.  According to their presentation from April 2009, the authors stated they planned to map the distribution of other species such as potassium chloride, silicon oxide, and disulfur monoxide in the summer of 2009 using the APEX antenna in Chile, and will submit a proposal to observe Io's atmosphere at much higher resolution using the ALMA telescopes when they are finished in 2012.

Link: Simultaneous mapping of SO2, SO, NaCl in Io’s atmosphere with the Submillimeter Array [dx.doi.org]
Link: Presentation - Mapping of SO2, SO and NaCl emission in Io's atmosphere [www.cfa.harvard.edu]

Friday, February 26, 2010

LPSC 2010: Simulating Io's Auroral Emission in Eclipse

Yesterday, we talked about a model of Io's atmosphere using the Direct Simulation Monte Carlo (DSMC) method.  Today we look at another Monte Carlo (MC) model of Io's atmosphere, this time focusing on simulating the emission of Io's atmosphere during an eclipse.  Like the research discussed yesterday, both the abstract for next week's Lunar and Planetary Science Conference (LPSC) and a new paper in press in Icarus are available.  The LPSC abstract is titled, "Io's UV-V Eclipse Emission: Implications for Pele-type Plumes," by Chris Moore, David Goldstein, Philip Varghese, and Laurence Trafton.  This research will be presented as a talk next Wednesday afternoon, March 3 in the Planetary Atmospheres session.  The Icarus paper in press is titled, "Monte Carlo Modeling of Io’s [OI] 6300 Å and [SII] 6716 Å Auroral Emission in Eclipse," by Chris Moore, K. Miki, David Goldstein, K. Stapelfeldt, Philip Varghese, Laurence Trafton, and R.W. Evans.  Both cover the topic of simulating Io's auroral emission when the satellites goes into eclipse, but under different regimes: the LPSC abstract discusses emissions in the mid-ultraviolet as the result of SO2 and S2, while the Icarus paper talks about emissions in the red portion of the visible spectrum from oxygen (from decomposed SO2).

Last year, this same group published a paper on the dynamics of Io's atmosphere during an eclipse, which occurs each Ionian day when the satellite passes into the shadow of Jupiter.  Each eclipse lasts around 2 hours and 20 minutes.  During this time, no direct sunlight reaches Io surface, though Europa-shine and refracted sunlight from Jupiter's atmosphere can faintly illuminate the surface.  The authors found that Io's atmosphere doesn't completely collapse during an eclipse, as a diffusion layer of non-condensable atmospheric species like oxygen and sulfur monoxide forms near the surface, preventing sulfur dioxide above it from condensing out on to the surface.  With their model from last year's paper in hand, the authors further examined it, seeing how their model results would appear at different emission bands of the species they included in their model atmosphere (SO2, O, SO, S, and O2).  They also examined the emission from S2 gas present in volcanic plumes like Surt and Pele, and the effects of volcanic activity on the other emission bands.

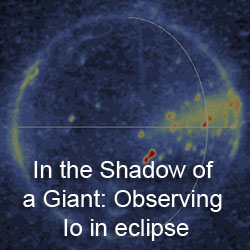
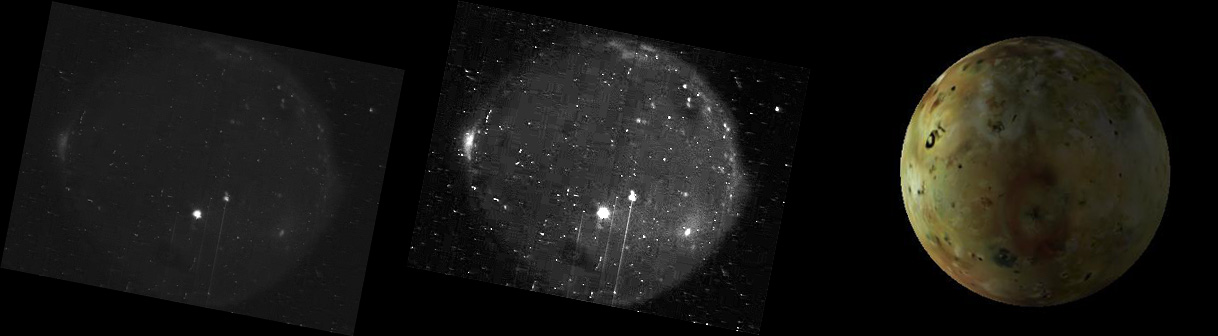
In their Icarus paper, Moore et al. focused on two emission bands, the prominent [OI] oxygen emission line at 630 nm and the much fainter [SII] band at 670 nm (both in the red portion of the visible spectrum).  Thus in the image above, the emission examined would be colored in red, so that covers much of the limb glow.  This limb glow shifts between the north and south polar region of Io, as seen by Galileo and Cassini.  Observations by Trauger et al. 1997 also revealed a high altitude bright spot in the [OI] line over the leading hemisphere, which is actually on the wake side of Io since the magnetosphere of Jupiter spins faster than Io revolves around Jupiter.  Moore's simulation of Io's atmosphere in eclipse was able to match the observed position of the bright wake spot, but not its intensity.  The model suggests that the position of the wake bright spot (which can be seen either above or below the equator) and the polar limb glows are related to the depletion of electrons from the Io-Jupiter flux tube, which effects the 630 nm emission by Io's position above or below the plasma torus, volcanic plumes (particularly large polar plumes), the density of the polar atmosphere, and Io's effect on Jovian magnetic field lines.  The authors also found that the [SII] emission is much weaker than the [OI] oxygen line, in part because of the lower S+ (remember, the ratio of oxygen to sulfur in Io's atmosphere is roughly 2 to 1).

The LPSC abstract examines emission bands by SO2 and S2 in the mid-ultraviolet to the visible (250-600 nm) as Io ingresses into an eclipse.  The authors found that the distribution of this emission across Io's sub-jovian hemisphere (the area covered by Trauger et al. 1997 Hubble observations) is strongly effected by volcanic plume activity.  These plumes act as shields for the atmosphere south of them from the electrons from the Jupiter-Io flux tube, reducing the energy of these electrons.  For example, if both the Surt and Acala plumes are active, the northern Surt plume shows up bright due to S2 emission above 300 nm, while Acala plume south of it appears fainter because molecules in its plume are not as excited by flux tube electrons.  The authors also examined the difference between the western and eastern halves of the sub-Jupiter side of Io at these wavelengths.  With the Surt and Pele plumes active, the emission from Io was much greater than if they were off.  The ratio between the eastern and western halves was greater than one when both are off because of emission from SO2, which as a greater density on the eastern half because before the eclipse, it had been in the afternoon (remember from the article yesterday that Io's sublimation atmosphere peaks in density where the frost temperature is greatest, around 2pm in the afternoon).  When both plumes are one, that ratio becomes less than one as the brightness of the S2 emission from the Surt plume dominates the brightness on the western side.  With significant differences such as these, the authors suggest that even barely disk-resolved spectra, particularly around 300 nm, can be useful for determining the activity of volcanic plumes on Io from Earth-based data.

These two papers explore Io's auroral emission at various wavelengths from the mid-ultraviolet to the visible using a simulation to explain the observations we have on hand.  They show that the auroral glow of Io's atmosphere is affected by volcanic plume activity, such that observations from Earth can be used to determine the presence or absence of different plumes, Io's position in the magnetosphere, and the density of Io's atmosphere.  These simulations also explore the various chemical species in Io's atmosphere and how even minor constituents like oxygen, formed from the disassociation of sulfur dioxide, can have a strong effect on its auroral, so vividly seen when Io is in eclipse.

Link: Io's UV-V Eclipse Emission: Implications for Pele-type Plumes [www.lpi.usra.edu]
Link: Monte Carlo Modeling of Io’s [OI] 6300 Å and [SII] 6716 Å Auroral Emission in Eclipse [dx.doi.org]

Thursday, February 25, 2010

LPSC 2010: Modeling Io's Atmosphere in Three Dimensions

Okay, it is about time I finished up my coverage of the abstracts covering Io science for next week's Lunar and Planetary Science Conference.  Today I am going to talk about "Modeling the Sublimation-Driven Atmosphere of Io with DSMC" by Andrew Walker, Sergey Gratiy, Deborah Levin, David Goldstein, Philip Varghese, Laurence Trafton, Chris Moore, and Benedicte Stewart.  A paper in press in Icarus was published last month by the group covering this topic, "A comprehensive numerical simulation of Io’s sublimation-driven atmosphere".  This post will act as a summary of both the LPSC abstract and the paper.  The LPSC paper will be presented as a talk next Wednesday afternoon, March 3 in the Planetary Atmospheres session.

In their model, Walker et al. used the Direct Simulation Monte Carlo (DSMC) method for simulated Io's rarefied atmosphere in three dimensions.  Previous modelers explored Io's atmosphere as a single dimension, looking at how column density and temperature changes over the course of a day in response to changes in surface temperature, or as a two dimensional model that looked at how these parameters changed across a single latitude, axi-symmetric with the sub-solar point.  With a three dimensional model, the authors were able to explore the effects on Io's atmosphere from volcanic plume activity at known volcanoes like Pele and Prometheus, plasma bombardment heating from above, planetary rotation, sub-solar temperature (115-120 K), the residence time of fine-grained sulfur dioxide frost on bare rock, and variations in frost temperature and areal coverage.  The DSMC method models individual sulfur dioxide molecules (usually representative of the total number of molecules), which is useful when the atmosphere has such low density that the mean free path of sulfur dioxide molecules exceed that the length over which many gas properties propagate.  Similar modeling was performed by Austin and Goldstein 2000, though this new model includes the inhomogeneous frost coverage mapped by Galileo NIMS. This also allows the authors to graph variations in the translational, vibrational, and rotational temperatures (related to the different emission bands of sulfur dioxide based on motions of the S-O bonds), density and column density (number of sulfur dioxide molecules per cubic centimeter or over a square centimeter of Io's surface, respectively), and flow rate (expressed in the article as mach number).

Since the authors primarily modeled the sublimation component of Io's atmosphere, the column density and many of the other properties of the lower atmosphere were related to the temperature and areal coverage of sulfur dioxide frost on the surface as this part of the atmosphere would be in vapor-pressure equilibrium with that frost.  Because of the difference between the position of the peak frost temperature and the sub-solar point, ~30° to the east or 2pm local time, the column density near the surface peaks to the east of the sub-solar point.  This lag in peak frost temperatures results from the thermal inertia of SO2 frost.  Changing the sub-solar peak temperature from 115 K to 120 K causes a five-fold increase in the peak atmospheric column density from 4.7×1016 cm–2 to 2.7×1017 cm–2.  This brackets the lower and upper bounds for the atmospheric column density measured by earlier observers of Io's atmosphere.  Compare this to the column density to the Earth's, which is ~3×1025 cm–2.

I should point out at this point that this group published a companion paper (Gratiy et al.) that actually showed up in the Icarus in press page first, and was discussed here last month.  This paper compared their model of Io's atmosphere to actual observations taken a ultraviolet, infrared, and millimeter wavelengths.  One note that Walker et al. does make is that the variation in column density with latitude doesn't seem to match the Hubble Lyman-α observations, which showed a sharp drop-off in atmospheric density poleward of ±45°.  They suggest that this could be because of differences in frost temperature from the assumed cos1/4(ψ) latitudinal variation.

In other results, the authors found that heating from the Io plasma torus inflates the upper atmosphere of Io and keeps the nightside atmosphere from completely freezing out.  Plasma from Jupiter's magnetosphere only penetrates down to an altitude of 1 km at the point of peak frost temperature, and the altitude decreases the further you get from that point, reach the surface at the poles and on the nightside.  This actually means that the low altitude translational temperature of the SO2 in the atmosphere is higher on the nightside (where plasma reaches all the way to the surface due the lower atmospheric density) and particularly along the terminator.  At the terminator, the higher density dayside atmosphere interacts with the low density nightside atmosphere, leading to supersonic gas flow just past the dusk terminator and near the poles.

Tomorrow we will take a look at another LPSC abstract and Icarus paper by this group on modeling Io's auroral emission.

Link: Modeling the Sublimation-Driven Atmosphere of Io with DSMC [www.lpi.usra.edu]
Link: A comprehensive numerical simulation of Io’s sublimation-driven atmosphere [dx.doi.org]

Thursday, February 4, 2010

LPSC 2010: Modeling the Volcanic Plume of Pele

For the last couple of weeks, we have been examining the Io-abstracts submitted for next month's Lunar and Planetary Science Conference.  Today we take a look at a paper submitted by William McDoniel, David Goldstein, Philip Varghese, Laurence M. Trafton, and Benedicte Stewart titled, "DSMC Modeling of the Plume Pele on Io." For this paper, the authors modeled the plume of Pele using a curvilinear source region.  The goal is to replicate not only the extreme height of Pele's large plume, but also the elliptical shape of the red deposit it leaves on Io's surface.  This research will be presented as a poster at the Planetary Atmospheres session on Thursday, March 4.

During last year's Lunar and Planetary Science Conference, McDoniel and his colleagues reported on their computer modeling of volcanic plumes that erupt from irregularly-shaped vents, such as those that would be expected from the flow front of a lava flow.  The group uses the Direct Simulation Monte Carlo (DSMC) method for simulating the motion and properties of gas molecules within a rarefied flow like an Ionian volcanic plume.  The method was previously used with great success in 2-D space, which is appropriate for replicating the height, width, and appearance when projected against black space, by Zheng et al. 2003 for a Pele-type plume and Zhang et al. 2004 for a Prometheus-type plume.  DSMC modeling is also being used to simulate the entire atmosphere of Io as generated by sublimation and volcanism and what can happen to the atmosphere when Io is in the shadow of Jupiter. The work done by McDoniel and his colleagues at the University of Texas in the last few years has been to extend the earlier plume modeling into the third dimension in order to match the 3D shape of Ionian plumes and their non-circular deposits on the surface.  As mentioned, last year the authors examined a half-annular vent region, as opposed to the circular vent region assumed by Zheng et al.  This was done to simulate the Prometheus plume, which is generated by the interaction between warm silicate lava and surficial sulfur dioxide frost at a broad, half-circular lava flow front.  They found that such as vent geometry generated a plume that was roughly similar to one generated from a circular vent source, but with prominent jets forming along the inner concave portion of the half-annulus vent area and at the ends of convex side.  These jets had some effect on the strength of the canopy shock (the upper bright region of a plume), but the plume deposit was still roughly circular, albeit shifted in the direction of the convex side of the half-annulus source.

This year, McDoniel et al. have shifted their attention to the larger Pele plume.  The Pele plume is one of the largest on Io and was seen off and on by Voyager 1, Galileo, and the Hubble Space Telescope.  Fallout from this plume produces a large red ring that encircles the Pele volcano at a distance of 400-600 kilometers.  Two of the major features of this deposit are its elliptical shape where it is more elongated in the north-south direction and its subtle changes in shape and localized intensity over time.  McDoniel et al. used a DSMC model of the eruption conditions of Pele (sulfur and sulfur dioxide-rich gas desolving from lava fountaining at an active lava lake) and a Galileo image from the I24 encounter in October 1999 of a portion of the lava lake as a representation of the vent geometry in order to replicate the shape of the Pele plume deposit.  There simulations showed an elliptical plume deposit, with the elongation roughly perpendicular to the curvilinear line of thermal hotspots assumed to be vent sources.  Closer to the vents, the research found that jets should be created generated by the concave portions of the curvilinear line of small gas vents, including the ends of the line of vents.  The jets are associated with areas of greater deposition in the fallout region far from the vent.

What I think is most significant about this research is that it suggests that a roughly linear Pele-type plume source, like this curved line of hotspots, should produce an elliptical plume deposit.  The elongation of this deposit should be perpendicular to the trend of linear source.  Variations in intensity of the deposit are related to stronger jets resulting from deviations from the linearity of the plume source, like the concave and convex sections of the source used in the simulation.  Now, the exact source they used for their simulation may not be the source of the Pele plume, as there is a much more intense section of the Pele lava lake to its east, as seen during the I32 encounter.  Interestingly enough, this intense portion is an elongated depression that is perpendicular to the elongation of the Pele plume deposit, which is what you would expect if it is the source of the plume based on this simulation.  Variations in the deposit may result from different portions of this active region turn on or shutting off, producing jets in the plume.

Very intriguing research, IMHO!  Certainly it provides an explanation for the shape of Pele's plume and provides a possible explanation for changes in the shape and intensity of its deposit on the surface.  A more linear source would be expected from a fissure-like eruption, which is what you would expect from an explosive eruption that produces a short-term giant plume, like Grian, Tvashtar, Surt, or Dazhbog.  This may explain why at least Grian also produced an elliptical plume deposit.

Link: DSMC Modeling of the Plume Pele on Io [www.lpi.usra.edu]

Wednesday, February 3, 2010

LPSC 2010: Re-examining the Iothermal Gradient

For the last couple of weeks, we have been examining the Io-abstracts submitted for next month's Lunar and Planetary Science Conference.  Today we take a look at a paper submitted by Giovanni Leone, Lionel Wilson, and Ashley Davies titled, "The Geothermal Gradient of Io: Consequences for Lithosphere Structure and Volcanic Eruptive activity." For this paper, the authors modeled the structure of Io's lithosphere by calculating how its temperature varies with depth.  This research will be presented as a poster at the Igneous and Volcanic Processes session on Thursday, March 4.

Io's internal heat, generated by tidal stresses on Io's mantle, is released through volcanic activity in a process called advection.  As opposed to convection or conduction, with advection, heat is transported from a system through a warm liquid, in this case, liquid hot magma.  The model used by Leone and his colleagues was first developed in O'Reilly and Davies 1981 in order to explain how Io's lithosphere could be releasing so much heat (2.4 Watts per m2) yet still hold up Io's steep paterae walls and tall mountains.  A conducting crust would be far too warm at shallow depths and too thin to hold up these structures.  Thus, thanks to advection, all of the internal heat from the asthenosphere is released through volcanic eruptions and the lithosphere stays pretty cool except for the lower two to three kilometers of the 30-kilometer thick lithosphere, preventing viscous relaxation of Io's topography (see the craters of Saturn's moon Enceladus to see how viscous relaxation can distort topography).

For their model, Leone et al. used two equations from O'Reilly and Davies 1981 as well as improved knowledge about the chemistry and properties of Io's lithosphere to calculate the geothermal (or iothermal, if you will) gradient within the lithosphere, from the cold (100 K) surface to the lithosphere/asthenosphere interface at a depth of 30 kilometers and a temperature of 1500 K. Their inputs include estimates for the porosity of the lithosphere as a function of depth, the density of the magma, the globally-averaged, advected heat flux, radiogenic heatign rate, the magma specific heat, latent heat of crystallization, and thermal diffusivity. From these equations, the authors derived the lithospheric density, pressure, and temperature at different depths in Io's lithosphere. As expected, the lithosphere remains below the melting point of sulfur dioxide from the surface down to a depth of 21 kilometers. It remains below the melting point of sulfur until a depth of 26 kilometers. Much of the lithospheric heating takes place in the bottom few kilometers of the lithosphere.

The iothermal gradient generated by Leone's model does support the transport of magma all the way to the surface. Without any entrained volatiles, magma from the asthenosphere can rise to a depth of 23 kilometers before becoming negatively buoyant and forming magma reservoirs, assuming a pore-space fraction of 30% at the top of the lithosphere. As mentioned above, this is within the depth range of the melting point of the dominant volatiles on Io, sulfur and sulfur dioxide. These may then become entrained in the lava, allowing the magma to rise further to the surface. Leone et al. conclude that with volatile contents as low as 5% by mass, magma should be able to reach the surface using reasonable values for lithospheric porosity. With even more volatiles, such as the 10-30% suggested at some plume sites like Tvashtar, the modeled iothermal gradient would support the kinds of high eruption speeds observed at that volcano. They conclude "that there should be a positive correlation between mass eruption rate and volatile content." So it should not come as a surprise that major eruption on Io, like Tvashtar 1999/2001/2007, Thor 2001, Grian 1999, and Pillan 1997 all had volcanic plumes.  Finally, they also place a limit on the porosity of Io's lithosphere at the surface at 38% as magma could not ascend into the lithosphere above that level, the crust would be too light.

Another factor that the authors examined was the effect that changes in the advected heat flow would have have on the lithosphere.  Just as Kirchoff and McKinnon found last year, a decrease in volcanic activity but not a decrease in the amount of heat generated in the mantle (i.e. the temperature remains the same) would leading to a heating of the lower to mid-lithosphere, possibly leading to some melting.  In Leone's model, the gradient changed from a steep curve at 2.4 W/m2 (remaining relatively cool until close to the lithosphere/asthenosphere boundary) to a much shallower one at 0.5 W/m2.

With this model of Io's geothermal gradient, Leone and his co-authors have placed limits on the amount of pore spaces are possible in Io's lithosphere.  Their model is supported by their ability to replicate the ascent of magma to the surface, which is readily visible on Io's surface.  Their model also helps support the argument that the volatiles in Io's lava are incorporated into its magma within reservoirs in the lithosphere.  I would be interested to see how this model fits with the view that the upper 2-3 kilometers of Io's lithosphere maybe dominated by volatiles with silicates being predominant deeper into Io.

Link: The Geothermal Gradient of Io: Consequences for Lithosphere Structure and Volcanic Eruptive activity [www.lpi.usra.edu]

Saturday, January 30, 2010

LPSC 2010: Determining Volcano Eruption Styles from Infrared Spectra

For the last two weeks, we've been looking at the Io-related abstracts for presentations at this year's Lunar and Planetary Science Conference.  Today we will look at a presentation titled "The Thermal Signature of Volcanic Eruptions on Io and Earth - Implications for a Future Mission to Io" by Ashley Davies, Laszlo  Keszthelyi, and Andrew Harris.  This paper will be presented as a poster at the Igneous and Volcanic Processes session on Thursday, March 4.

In this poster, Davies et al. will present a method for determining the eruption style of a volcano based on the near-infrared spectrum of the volcano taken from space, either a satellite observing the Earth or spacecraft or ground-based observations of Io.  This is done by examining the shape of near-infrared spectra taken of a volcano between two and five microns, the slope of this spectra between these two wavelengths, and how the shape and slope of the spectra change with time.  This methodology allowed the research to differentiate between insulated flows and lava lakes on Earth.  Extended to Io, the authors were able to predict based on spectra with a low-spatial resolution the eruption styles at a number of volcanoes such as Pele and Prometheus that was also confirmed, this time using higher-resolution observations later in the Galileo mission.

In the case of active lava lakes like Pele, they found that the ratio between the power output at 2 microns and 5 microns to be near unity.  As active lava lakes this makes sense as there is a fixed amount of terrain (remember, the lava lakes are bound by the patera margin) covered with cooling lava that is renewed with fresh lava on a regular basis.  So the power output at the two wavelengths is about the same.  For insulated flows, there are generally small areas where fluid lava is exposed at the surface both at the source vent and at the active flow lobe.  The vast majority of the insulated flow is covered by cooling lava whose thermal emission is concentrated at longer wavelengths like 5 microns, compared to the hotter vent and flow front, whose thermal emission will be concentrated at shorter wavelengths, like 2 microns.  So, for insulated flows like Prometheus and Amirani, the power output at 5 microns is greater than at 2 microns.  The ratio between 2 microns and 5 microns decreases as eruption intensity decreases.  Interestingly, many paterae have a similar signature, but it is not known if this due to these paterae, like Tupan, Malik, and Hi'iaka, being more quiescent lava lakes than Pele or due to insulated flows on the floor of these volcanoes.

Eruption style can also be determined by monitoring how the spectra of these features can change with time.  The authors in the abstract highlight research into the Pillan eruption.  In that case, the first near-IR observations of Pillan revealed a 2μm/5μm ratio near unity, suggesting a rigorous eruption with lava fountaining and open channel flows.  As the eruption progressed, its total power decreased as did the 2μm/5μm, show the shutting down of the fountaining and an increased area of the cooling flow.  A similar eruption progress was seen at an outburst in 1990, though in that case, along with other outburst eruptions like Surt in 2001, the 2μm/5μm ratio was actually greater than 1 initially, suggesting an initial phase of very vigorous lava fountaining with only a small area of emplaced lava at that point in the eruption.

Finally, the authors suggest ways to apply this methodology on a future mission to Io.  They suggest including filters at two and five microns in a thermal mapper in order to directly apply their method.  They also suggest two at longer wavelengths such as 8 and 12 microns to further constraining the amount of cooler lava flows that are older than those that would detected at 5 microns.  They also suggest that observation often enough to detect changes in eruption style or thermal emission that would further constrain that style, like a vigorous outburst eruption that starts out with high thermal emission at short wavelengths, then cools down as the eruption shuts down or changes to an insulated flow style, like Thor.  The authors do point out that this type of analysis can be done at low-spatial resolutions, so regular observations would not need to be conducted just during Io flybys.

Link: The Thermal Signature of Volcanic Eruptions on Io and Earth - Implications for a Future Mission to Io [www.lpi.usra.edu]

Friday, January 29, 2010

LPSC 2010: Heat Flow from Dark Paterae Floors

Last Wednesday, the abstracts for this year's Lunar and Planetary Science Conference were posted online and since then I have been discussing a few of these abstracts here on this blog, including ones on the new global geologic map to the stability of patera margin slopes.  Today we are going to take a quick look at an abstract by Glenn Veeder, Ashley Davies, Dennis Matson, Torrence Johnson, Dave Williams, and Jani Radebaugh titled, "Io: The Dark Paterae Component of Heat Flow".  In this abstract, the authors discuss new thermal modeling work based Galileo NIMS, SSI, and PPR infrared data and the USGS global basemap.  This modeling was done to determine the contribution to Io's heat flow made by dark material on the floor of volcanic depressions known as paterae.

Io's total heat flow, ~9.5×10¹³ W, has been measured from disk-integrated, ground-based IRTF data along with incomplete global data from Voyager IRIS and Galileo PPR.  Galileo's SSI camera and NIMS near-infrared spectrometer acquired more complete global data (except over the polar regions), providing information on current or recently active volcanoes, but most of Io's heat flow is released at much longer infrared wavelengths from cooling lava flows, wavelengths IRTF, IRIS, and PPR were sensitive to.  To inventory how Io's internal heat is released, the authors created a thermal model to estimate the amount of total energy released by volcanoes that are either outside of the terrain covered by IRIS or PPR, or were too small for those instruments to detect.  In 2008 and 2009, this same group examined the contribution to Io's total heat flow from dark lava flows on the plains of Io (e.g. Amirani), both at LPSC in March 2008 and in a paper published in November 2009.

For this research, the authors mapped the distribution of dark paterae floor materials across Io's surface and measured their areas.  In total they found a total of 148,000 square kilometers, which is about 0.4% of Io's total surface area or a little less than the "dark patera floor" unit mapped by Williams et al.  The authors found that the distribution of dark patera floor material has a similar bimodal distribution in longitude (with peaks near 130° W and 315° W) as paterae in general.

Of the total mapped area, 30,500 km2 are composed of a combination of Io's two largest dark floored paterae, Loki Patera (shown above) and Dazhbog Patera.  The authors then took the areas of this dark patera floor material and using an effective temperature of that material, estimated their total power output.  The total average power output of these two volcanoes was modeled to be 9.6×10¹² W and 4.0×10¹² W, respectively.  In the case of Loki, this is 10% of Io's total heat flow.  Both modeled power outputs are close to the measurements made by PPR.  The other areas of dark paterae floor material account for six times that seen at Loki Patera, Io's most powerful volcano.

The abstract is part of research into how Io's internal heat is released, i.e. what heat sources make up Io's global heat flow.  Assuming the same effective temperature for all these materials as Loki, dark paterae would account for 70% of Io's total heat flow (compared to 5% for dark flow fields on the Ionian plains like Masubi or Amirani).  This makes dark paterae floor materials the most significant contributors to Io's heat flow. 

Link: Io: The Dark Paterae Component of Heat Flow [www.lpi.usra.edu]

Wednesday, January 13, 2010

Paper: Verifying a new model of Io's atmosphere by simulating multi-spectral observations

In November, the paper "Multi-wavelength simulations of atmospheric radiation from Io with a 3-D spherical-shell backward Monte Carlo radiative transfer model" was published in press in the journal Icarus.  The authors for this paper are Sergey Gratiy, Andrew Walker, Deborah Levin, David Goldstein, Philip Varghese, Laurence Trafton, and Chris Moore.  This paper takes a look at a computer model of Io's atmosphere, consisting of a composite of sublimation and volcanic sources and published in Walker et al. (submitted to Icarus but not yet available online), and attempts to validate the model by comparing simulated observation derived from the model to real observations published over the last decade.  I have to admit that this paper covers a topic that is definitely out of my wheelhouse, so I may not cover the findings of this paper with as much depth as I have given to other papers recently, but I will do the best I can to provide a summary.

While I have not read the Walker et al. paper covering the details of this new model since it hasn't been accepted by Icarus and posted online, according to this paper, it is a 3-D global rarefied gas dynamics model that uses both volcanic plumes and sublimation of surface sulfur dioxide (SO2) frost as sources for the gas in Io's atmosphere.  The model takes into account changes to the column density of the atmosphere as a result to time-of-day changes to the surface temperature, distribution of SO2 surface frost, distribution of volcanic plumes (though they use persistent volcanic thermal hotspots as plume sites rather than confirmed plume locations or the locations of large surface changes), plasma heating from Jupiter's magnetosphere, and heat loss to space.  For this paper, the authors used a backward monte carlo method to simulate how their model atmosphere would appear in different types of observations.

In Gratiy et al. 2009, the authors compared their model results to three observations: disk-integrated, high-spectral resolution measurements in the mid-infrared near 19-µm published by Spencer et al. 2005; disk-resolved, far-ultraviolet observations in the hydrogen Lyman-α band published in Feldman et al. 2000; and disk-integrated, millimeter wavelength observations published in Io After Galileo in the Io's Atmosphere chapter by Lellouch et al.

First, the authors compared their model output to observations published in Spencer et al. 2005.  For that paper, Spencer observed 16 SO2 ν2 vibrational band absorption lines using the TEXES mid-infrared spectrometer at the NASA Infrared Telescope Facility.  This was disk-integrated spectra centered around 19 microns.  From this data, the authors found a significant longitudinal asymmetry in absorption band depth, a measure of the average column density over the hemisphere sampled, with a low band depth (1%) compared to the continuum level at 315°W (the hemisphere centered near Ra and Loki) and a much stronger bands (7%) at 180°W (the hemisphere centered near Colchis Regio).  This indicates that Io's atmosphere is denser over the anti-Jupiter hemisphere than over the hemisphere centered on Ra and Loki.  This distribution correlates to the distribution of surface frost, but it also correlates with the distribution of volcanic plumes, as Gratiy et al. notes.  The authors of this new paper found that a combined model with sublimation and volcanic sources with long residence times (5000 seconds) for condensed SO2 on bare rock.  They also note that their model and the data from Spencer et al. seem to support a thermal lag where the surface temperature and thus frost sublimation peaks 3.5 hours, or 30° of rotation, after local noon.  This is akin to the terrestrial experience of the air temperature being warmer in the mid- to late-afternoon, as opposed to right at noon when the sun is at its highest point in the sky.  However, if you look at the PPR day-side data from I31, shown at right from Rathbun et al. 2004, there maybe some question of whether that thermal lag is real.

The next dataset the authors compared their model to was the Lyman-α data disk-resolved observations published in Feldman et al. 2000 and Feaga et al. 2009 (the latter paper was discussed here last year).  This data was acquired using the Space Telescope Imaging Spectrograph (STIS) on Hubble between 1997 and 2001.At these far ultraviolet wavelengths, areas where Io's atmosphere are denser absorb sunlight, appear dark in Lyman-α images.  Sunlight is better able to reach the surface and reflect back into space in order to be seen by Hubble.  Thus, areas where Io's atmosphere is thinner appear brighter in Lyman-α images.  An example of one of these images is shown at top.  Gratiy et al. could not reproduce this data with their model, suggesting that they do not properly simulate the latitudinal variation in the column density of Io's atmosphere (thicker at the equator, thinner at the mid-latitudes and poles).  In particular, they had difficulty reconciling the observed sharp increase in Lyman-α brightness, and therefore the sharp decrease in atmospheric column density, 45° North or South of the equator, and with the utter lack of atmosphere beyond 60° North or South latitude.  This cutoff, the authors suggest, is more consistent with the distribution of surface changes and volcanic hotspots, as opposed to surface frost.  However, there don't seem to be variations in the Lyman-α images resulting from known volcanic plumes.  The lack of an east-west asymmetry on either side of the central meridian in Io's equatorial brightness in the far-ultraviolet data that would be expected from the Walker et al. model suggests that the surface thermal inertia is much lower than they used for that model.

In the final comparison, Gratiy et al. compared their model to disk-integrated millimeter-wave SO2 emission line profiles obtained at IRAM 30-meter telescope in Spain, published in Io After Galileo in the Io's Atmosphere chapter by Lellouch et al. and disk-resolved data in Moullet et al. 2008.  The authors determined that strong atmospheric winds explain the wider SO2 emission lines in the IRAM data compared to what would be expected from thermal Doppler effects alone.

To be honest, this was a difficult paper for me to get through, hence why it took a month and a half for me to get this summary up.  So, I apologize for not explaining the paper's conclusions as well as I could have.  Basically, the authors hope that by comparing their rarefied gas dynamics model of Io's atmosphere with real observations they can make some improvements to that model that also provide new information about Io, such as the presence and strength of atmospheric winds, the surface thermal inertia, and the relative contribution of frost sublimation and volcanic plumes to Io's atmosphere.

Link: Multi-wavelength simulations of atmospheric radiation from Io with a 3-D spherical-shell backward Monte Carlo radiative transfer model [dx.doi.org]

Friday, December 11, 2009

A Few New Io/Jupiter System Papers

Sorry for the hiatus there is posts over the last couple of months.  I've just been a bit busy with Cassini plus I wanted to take a bit of a break after posting so much in September and October.  I wanted to post a quick note letting you all know about three new Io/Jupiter System related papers currently in press in the journal Icarus.

The first is titled, "Geologic mapping of the Hi'iaka and Shamshu regions of Io" by Melissa Bunte, David Williams, Ronald Greeley, and Windy Jaeger.  This paper is the latest in a series that covers the geologic histories of some of the regions observed at high- and medium-resolution by Galileo during its flybys in the late 1990s and early 2000s.  Back in March, I covered the authors' LPSC abstract on this research so you can read up on that while I slowly get through this paper and post a summary over the weekend (hopefully, there is a major Titan flyby today whose data comes back Sunday morning).

The other Io paper is titled, "Multi-wavelength simulations of atmospheric radiation from Io with a 3-D spherical-shell backward Monte Carlo radiative transfer model" by Sergey Gratiy et al.  Yeah, that's going to take me a bit longer to get through.  Hopefully I can post something next week.

The final paper that caught my eye in Icarus is titled, "Global geological mapping of Ganymede" by G. Wesley Patterson et al.  This paper discusses the completed Ganymede global geologic map and presents research on the observed geologic units on that satellite.  Again, I've only flipped through the article, and maybe later this month I can write up something about it.

Monday, June 22, 2009

New Paper: Tidal Dissipation on Io and Jupiter

While I was away, a new paper was published in the journal Nature on astrometric measurements of Io's orbit, looking at changes of that orbit (as well as Ganymede and Europa) over a period of 116 years, the number of years covered by the observations used. This paper is authored by Valéry Lainey, Jean-Eudes Arlot, Özgür Karatekin, and Tim Van Hoolst and is titled "Strong tidal dissipation in Io and Jupiter from astrometric observations."

The authors "numerically integrated the full equations of motion for the three satellites' center of mass" and fitted their model to astronomical observations of the Jupiter system acquired between 1891 and 2003. This allowed them to more accurately determine long-period terms in the interaction between the three satellites and Jupiter. For example, one goal of these types of models is to determine whether these three satellites are moving away or toward Jupiter. In other words, are the periods and semi-major axes of these satellites' orbits increasing or decreasing? Previous models gave often drastically different results based on fewer observations. Using this longer time-span of astrometric observations and fitting for the rate of tidal dissipation within Io and Jupiter, Lainey et al. determined that Io is slowly spirally in toward Jupiter (decrease of 55 kilometers in the semi-major axis of Io's orbit in 116 years), while Europa and Ganymede are spirally outward from Jupiter (an increase of 125 km and 365 km, respectively).

This change in the orbital and rotational periods of these satellites shows that Io, Europa, and Ganymede are slowly leaving a state of Laplace Resonance, where Europa's orbital period is twice that of Io and Ganymede's is four times that of Io. It is this resonance that helps prevent Io's orbit from circularizing. Because Io's orbit is eccentric (non-circular), the gravitational pull of the tidal bulge Io creates on Jupiter varies depending on the position of Io in its orbit. This varying gravitational pull causes friction within Io's interior, which is dissipated as heat. If Europa and Ganymede's orbits increase in size and Io's orbit decreases in size, then eventually this resonance will be broken. Once this happens, Io's orbit will slowly circularize and reduce the amount of tidal energy that is dissipated as heat, causing Io to become dormant.

While much of this part of the paper has been discussed quite a bit in the popular press (see articles from Ars Technica and New Scientist), another result from Lainey et al. is that the current rate of tidal dissipation is consistent with estimates of Io's global heat flow. Previously, it was suspected that Io was emitting more heat that was supported by the current tidal dissipation rate, suggesting that Io's interior was being heated up more in the past and it is now cooling down from that more intense period of tidal heating. Another theory suggested that the Laplace resonance between Io, Europa, and Ganymede goes through a cycles extreme tidal heating and dormancy. With the rate of tidal heating and the global heat flow being consistent with each other, such non-steady state heating models are not needed. However, as noted earlier, it still looks like these three satellites are slowly moving out of exact resonance. It was not shown whether a cyclical resonance system might still be possible.

Link: Strong tidal dissipation in Io and Jupiter from astrometric observations [nature.com]

Thursday, March 19, 2009

Hunga Tonga-Hunga Ha’apai eruption in Tonga

While Hunga Tonga-Hunga Ha’apai would be a great name for a volcano on Io, I am actually referring to the undersea volcano in the South Pacific island nation of Tonga. This seamount erupted yesterday producing a large steam and pyroclastic cloud reaching at least 15,000 feet into the air. The BBC has a video captured on a boat a few miles from the eruption site. The video clearly makes out the brighter steam and darker pyroclastic clouds. The large size of the eruption column is leading to disruption of Air New Zealand flights.

You can follow news about this eruption over at the Volcanism Blog, a great site to learn more about volcanic activity on Earth.

The closest analog to this eruption on Io would be an explosive eruption west of Zal Patera during the summer of 1997. Almost no lava was deposited during the eruption (within the limits of resolution and the annoying noise hits of our best images of the area), but there is evidence for an SO2 dust plume (analogous with the bright steam cloud seen at this Tongan eruption) and pyroclastics that produced a dark deposit that radiates out from the central vent (analogous to the dark cloud seen in the video linked above). Akin to sulfur dioxide plumes on Io, the steam cloud is produced as heat from the eruption boils off the water above the source vent. On Io, this "boiling off" normally occurs when lava flows over SO2 frost on the surface. The pyroclastic eruption at "At'am" would act remarkably like the pyroclastic flow here (though it would look less like a cloud, I would presume). There would be an initial ballistic phase as the largest clasts get sorted out. After a few kilometers, the pyroclastic column, consisting mostly of ash with low volatile contents, would collapse and move rapidly laterally along the surface. As can be seen at "At'am", the rapid speed of the pyroclastic surge allows it to climb up shallow slopes even on the 2 kilometer tall plateau, North Zal Montes.

Pyroclastic flows on Io were modeled by Smythe et al. back in 2001.

Sunday, March 15, 2009

Cannibalistic Jupiter

Recently I wrote a quick note on some research conducted by Robin Canup and William Ward that suggested that Jupiter "ate" many of the early generations of satellites that formed around it. After some digging, I found the paper these press articles were based on. The two researchers from Southwest Research Institute in Boulder, Colorado wrote a chapter in the upcoming Europa book to be published by the University of Arizona press titled, "The Origin of Europa and the Galilean Satellites." A pre-print is available at arXiv.org.

For the last few years, Canup and Ward have modeled the formation of Jupiter and the Galilean satellites. They believe that Jupiter and other gas giants like Saturn for more like stars than terrestrial worlds like Earth. Jupiter formed in a mini-nebula within the fledgling solar nebular 4.5 billion years. This mini-nebula began to spin and slowly collapsed, forming an inner core that would become Jupiter and a disk of gas and dust around its equator. Moons accreted from this disk of material, much like the terrestrial planets accreted in the inner solar system.

However, the two had a problem with their model. To form an appropriately sized Jupiter, they required an initial disk of material that contained around 10% of Jupiter's mass. This was reasonable, except the Galilean satellites contain around 2% of Jupiter's mass. Where did the other 8% go? They resolve this by modeling the formation of earlier generations of moons, which formed to a maximum size of Ganymede before it stopped accreting dust. However, these moons would slowly be dragged down toward newborn Jupiter by gas drag within the Jovian nebula. Eventually, these moons would be dragged all the way into Jupiter. The amount of material in the disk could have supported the formation of 20 large satellites, Europa to Ganymede-sized, mostly consisting of rock since the early disk would be too hot to allow for the condensation of water. Eventually, the disk would cool down, allowing water to condense. At the same time, gas inflow from the solar nebula had also stopped. This helps clear out much of the gas in the disk, putting a stop to the inward migration of the satellites at that time. The satellites that survived this cannibalistic stage are the moons we know today as the Galilean moons.

They also note a few other implications of their gas accretion model. For example, their late formation of the Galilean satellites, about 5 million years after the formation of calcium-aluminum-rich inclusions, is consistent with water-rich Ganymede and Callisto, water-glazed Europa, and nearly water-free Io. Their long formation times, 100,000 to 1 million years as the result of slower material inflow from the solar nebula, would also support the accretion of water-rich material on the outer moons and most of the accreted material would have come in the form of small impactors, in the range of 1 km across. Finally, the migration of Jupiter satellites, particularly Ganymede, during their formation could have led to the development of the Laplace resonance that has led to tidal heating on Io and Europa.

It should be noted that this process may have also occurred at Saturn, though only one large moon seems to have survived, with many smaller moons left behind as well. So yes, Goya's painting, "Saturn Devouring his Son" is appropriate here.

Link: Origin of Europa and the Galilean Satellites [arxiv.org]

Tuesday, March 10, 2009

A Final Look Back at Voyager 1 at Io

Over the last few days, we've been taking a look back at the Voyager 1 encounter with Jupiter and its volcanic moon, Io, that took place 30 years ago on March 5, 1979. For those of you who are just joining us, here are some quick links to those posts:
For this post, I want to wrap up our coverage of the anniversary of the Voyager 1 flyby by look at how our view or model of how Io works changed as a result of the flyby and how that model compares to our perspective now.

Before Voyager's close-up look in 1979, not much was known about Io. We knew from spectroscopic studies of Io and its environment that Io had sulfur on its surface and that is was surrounded by a cloud of sodium. From the earlier Pioneer 10 and 11 encounters, we also knew that Io was centered in one of Jupiter's radiation belt. This led to the hypothesis that the sodium cloud surrounding Io was the result of sputtering of an evaporite deposit, rich in sulfur and halite (also known as table salt), on Io's surface. In terms of its interior and geology, Io was expected to have an ancient surface similar to Earth's own moon considering that both worlds have a similar size and mass.

This model obviously changed as a result of the Voyager 1 flyby. Instead of an ancient surface, Voyager found a geologically active world with volcanism and mountains produced through tectonic motion. The images and spectra returned by the spacecraft provide brilliant confirmation for the model by Stan Peale, Patrick Cassen, and R. T. Reynolds that Io's interior was heated by the varying tidal pull of Jupiter on Io. This variation in the tidal pull is the result of the forced eccentricity in Io's orbit induced by the moon's orbital resonance with two other Galilean satellites of Jupiter, Europa and Ganymede. Over the next few years following the Voyager flybys, two competing models of Io's interior and geology developed. Simplifying things a bit, the two models basically attempted to explain what the composition of Io's lavas were.

In one model, all the volcanism on Io could be explained with sulfur. In this model, Io was overlain with a thick layer of sulfur and sulfur dioxide. The top layer of this sulfur would be solid, but it liquefied the further down you went, until you had a nearly global sulfur ocean underlying a solid sulfur crust. Imagine Europa with its water ice shell and water ocean underneath, but with sulfur instead of water. The multi-colored flows Voyager observed were explained as being the result of sulfur and its various allotropes flowing out across the surface; the dark volcanic pits were filled with boiling, pitch black sulfur. Underlying this sulfur shell was the silicate lithosphere. This lithosphere had to be active itself, as the mountains on Io had to consist primarily of silicates in order to sustain the heights seen by Voyager. In these cases, the mountains consist of parts of the silicate crust poking up above the sulfur shell. Silicate volcanism was thought possible beneath this shell, as silicate magma reaches up to the level of the sulfur-silicate interface before forming a sill and heating the sulfur above it. This model of primarily sulfur volcanism was supported not only by Io's multi-colored surface, but also by the temperatures seen at Io's volcanoes by the IRIS instrument on Voyager.

In the other model of Io's interior and volcanism, Io's crust consisted primarily of silicate rock with only a thin veneer of sulfur and sulfur dioxide. In this case, Io's lavas consisted of silicate rock, like volcanism on Earth (with some exceptions), with a sulfur enrichment. At the time of the Voyager flybys, this model was supported by the topographic structures visible on Io, which were not thought to be supportable by a crust that consisted primarily of sulfur. However, the thermal data to back it up didn't really come until 1986 when an eruption on Io's leading hemisphere was observed from Earth, and the blackbody radiation temperatures of the eruption were too high to be explained by sulfur. Other eruptions, including an eruption at Surt in June 1979, also had temperatures too high to be explained by sulfur. The lower temperatures seen by Voyager could be explained by the fact the IRIS instrument's wavelength band-passes were in the mid-infrared, wavelengths too long to sense the high-temperatures consistent with silicate volcanism. The discoveries made by Galileo in the 1990s and early 2000s seemed to put the nail in the coffin for the sulfur volcanism model as high-temperature volcanism (> 1000 K) was observed at many active volcanoes on Io and absorption bands consistent with orthopyroxene were found in some of Io's pyroclastic deposits.

The current consensus view of Io's volcanism, interior, and geology is in many ways seems like a merging of these two models. This consensus view was published in 2004 by Keszthelyi et al.. In this model, Io's crust consists primarily of silicate rock. As depth decreases, or as your approach the surface from Io's interior, the amount of sulfur in the lithosphere increases. This sulfur and sulfur dioxide is constantly being brought back up the surface, or recycled, by silicate volcanism. However, as silicates rise through the lithosphere from deeper magma reservoirs, they stall out as they become neutrally buoyant and form sills. These sills heat up the sulfur near it, which then melt, forming a depression on the surface and leading to sulfur volcanism (and some silicate volcanism as well). Over time, this depression deepens, allowing more silicates to reach the surface until the sill is unroofed and the bottom of the depression, or patera, becomes a silicate lava lake. I posted a more detailed explanation of this process last week.

The Voyager encounter with Io in March 1979 greatly increased our knowledge of Io as well as the rest of Jupiter system. It changed how we view the worlds of the outer solar system, making us scientists always expect the unexpected when we look at these worlds, even with an orbital mission like Cassini, where we have found active cryovolcanism on Enceladus and a dynamic climate system on Titan capable of producing large lakes at that moon's pole and great sand dune seas and canyonland terrain in the equatorial region.

It has been a pleasure looking back at the Voyager encounter with all of you. I hope you all enjoyed the mosaics I have put together over the last few days :) And thanks to Emily Lakdawalla for the shout-out on her blog.

Wednesday, March 4, 2009

Formation of Paterae on Io

Last week I talked about a paper in press in the journal Icarus on the Formation of Io's Mountains. More specifically, the paper described the sorts of stresses that could result in the formation of thrust faults that are the leading theory for how individual chunks of Io's crust are pushed upward to form some of the tallest mountains in the solar system. This week I thought I would talk about how the other major landform type on Io is formed: paterae.

Much of the following discussion is developed from two sources: Keszthelyi et al. 2004, "A post-Galileo view of Io's interior," and Ashley Davies's 2007 book, "Volcanism on Io: A Comparison with Earth."

The term patera is the name given by the International Astronomical Union for "irregular craters, or complex ones with scalloped edges." Patera (plural=paterae) comes from the latin for "saucer." On most planetary bodies, the term patera is generally used for volcanic pits, like Garland Patera on Venus, Leviathan Patera on Triton, or Uranius Patera on Mars. On Io, this is also the convention used. Radebaugh et al. 2001 counted and measured more than 400 paterae across Io's surface from Voyager and Galileo imagery and found that they average 41 km in diameter, larger than similar volcanic depressions on Earth, Venus, and Mars. While these features bare a resemblance to terrestrial calderas, there are issues with their formation being similar. Calderas on Earth (and other planets like Mars) are formed when freshly-emptied magma chamber collapses after an eruption and the ground above fills the void, leaving a depression on the surface. In the case of mafic-rich volcanoes, like Kilauea, a caldera forms from subsidence as a result of flows mostly outside the volcanic pit. For Io, Keszthelyi et al. point out that there is no evidence for major voluminous eruptions with flows outside of patera with enough lava to explain the scale of many of the patera on Io. Plus, the composition of magma on Io is not likely to be silicic like those found in eruptions that form large, Yellowstone-type terrestrial calderas. Tectonic extension may result in the formation of some of Io's patera, like Hi'iaka and Monan, but this is not thought to be the dominant process.

Keszthelyi et al. 2004 put forward another hypothesis for the formation of patera. This model is the result of the authors' examination of the post-Galileo view of Io's lithosphere and high-resolution images of paterae from Galileo and Voyager. In the post-Galileo view of Io's lithosphere, the upper layers are cold, composed of interbedded sulfur and sulfur dioxide ice and frost mixed with cooled silicate lava flows and pyroclastic deposits. The temperature increases dramatically as you near the base of the lithosphere, but for much of its thickness, it is fairly close to the surface temperature. This is the result of the heat-pipe advection theory that Io's internal heat is release almost entirely by volcanic activity, first proposed by O'Reilly and Davies 1981 and more extensively discussed in my post about Kirchoff et al. 2009. So there is very little convection of heat from the asthenosphere in the lithosphere. Anyways, what this means is that a crust with interbedded sulfur and silicate rich materials is actually remarkably stable and can form topography at least 10 km in height. The lower you get in the lithosphere, the more volatiles are driven out, and the more silicate-rich it becomes. This allows magma to ascend through this volatile-poor region. When it reaches the volatile-rich upper lithosphere, the magma eventually can find it difficult to ascend further as it becomes neutrally buoyant. The magma can then stall out and form a sill, an intrusive magma body that forms parallel to the pre-existing crustal layers.

Looking at high-resolution images of Io, particularly between Chaac and Camaxtli Paterae on the satellite's anti-jovian hemisphere, Keszthelyi et al. 2004 came up with a model for how these sills can develop into paterae. As magma continues to be injected into the forming sill, the lithosphere nearby becomes heated, particularly the volatiles in the immediate vicinity. Over a period of hundreds to a few tens of thousands of years, these volatiles (like sulfur and sulfur dioxide) melt and rise to the surface, forming sulfurous flows (along with some silicate magma that may also reach the surface), as well as move laterally through the sub-surface away from the growing sill. This maybe what is going on now at Sobo Fluctus. This movement of volatiles causes a partial collapse above the sill, forming a shallow patera similar to Grannos Patera. As the sill grows and more sulfur melts, the patera gets deeper, down to level of the partially molten S/SO2 near the sill. This causes the kind of sulfur flows you see at Balder Patera or Ababinili Patera. More basaltic magma reach the patera floor as well, forming silicate flows on the floor of the patera, like at Camaxtli Patera.

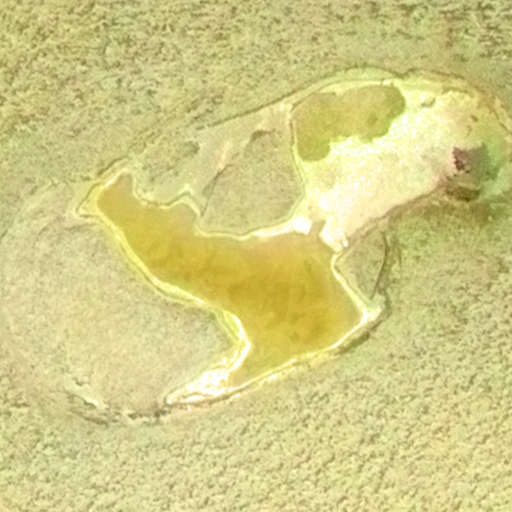
Eventually, more and more ground is "eaten" away above the sill so that it becomes "unroofed", with the top of the sill becoming the new floor of the patera. So now you see things like silicate lava lakes, for example, like you see at Loki Patera or Tupan Patera (see top of post). "Islands" in these lava lake paterae may be the result of sufficient cooling on the roof of the sill during its formation to create a thick crust near its middle (or at least the part right over the conduit at the bottom of the sill). As paterae remain active, they not only become deeper, until they reach the level of the underlying sill, but they also grow laterally as the silicate flows on the floor and the growth of the sill undermine the sulfur-rich walls of the patera. Keszthelyi et al. suggests that this would explain steep wall as this would remain an active process as long as the volcano itself remains active. We've even seen some paterae degrade mountains in this process, like at Gish Bar Patera, which is being "eaten" by Gish Bar Patera and Estan Patera.

The patera formation model presented in Keszthelyi et al. 2004 seems to explain not only the general morphology of paterae on Io, but also variations in this morphology from volcano to volcano, which seem to be the result of magma supply and age. The model also explains why no new paterae have formed since the beginning of spacecraft observations in 1979 as their formation is a much more gradual process than the 30-year time period of observations.

Link: A post-Galileo view of Io's interior [dx.doi.org]