Friday, August 27, 2010

High-Resolution Mystery in Bulicame Regio on Io

On February 22, 2000, Galileo flew close to Io for its 4th targeted flyby of the satellite with a altitude of 198 kilometers (a flyby known as I27).  Right at closest approach, Galileo turned its suite of remote sensing instruments at the southeastern edge of a low plateau east of the active volcano Isum Patera, on the southern end of Bulicame Regio.  The camera was pointed significantly off nadir and was instead looking much closer to the local horizon at an emission angle (an angular measure of how far a point on the surface is from nadir: looking straight down is 0° and looking at the horizon is 90°) was   The observation, 25ISSAPPNG01, was designed to look for evidence of sapping and other slope degradation processes on the margin of this plateau.  Sapping, a geologic process by which sulfur dioxide in gas or liquid form escapes from a mountain slope, undermining the slopes strength and causing it to downslope movement.  Four images were planned for this observation and three were eventually played back, though only 2/3rds of the lines of each frame (525 out of 800) were played back due to the limited amount of downlink available since the camera and spacecraft worked perfectly during this encounter, in contrast to the camera and spectrometer anomalies experienced during I24 and the spacecraft safing event on I25 that led to loss of data.  However, in the 10 years since these images were sent back from Galileo, they have become a bit of a mystery for planetary scientists, as interpreting the geology of the terrain seen in the images of 25ISSAPPNG01 has been difficult.

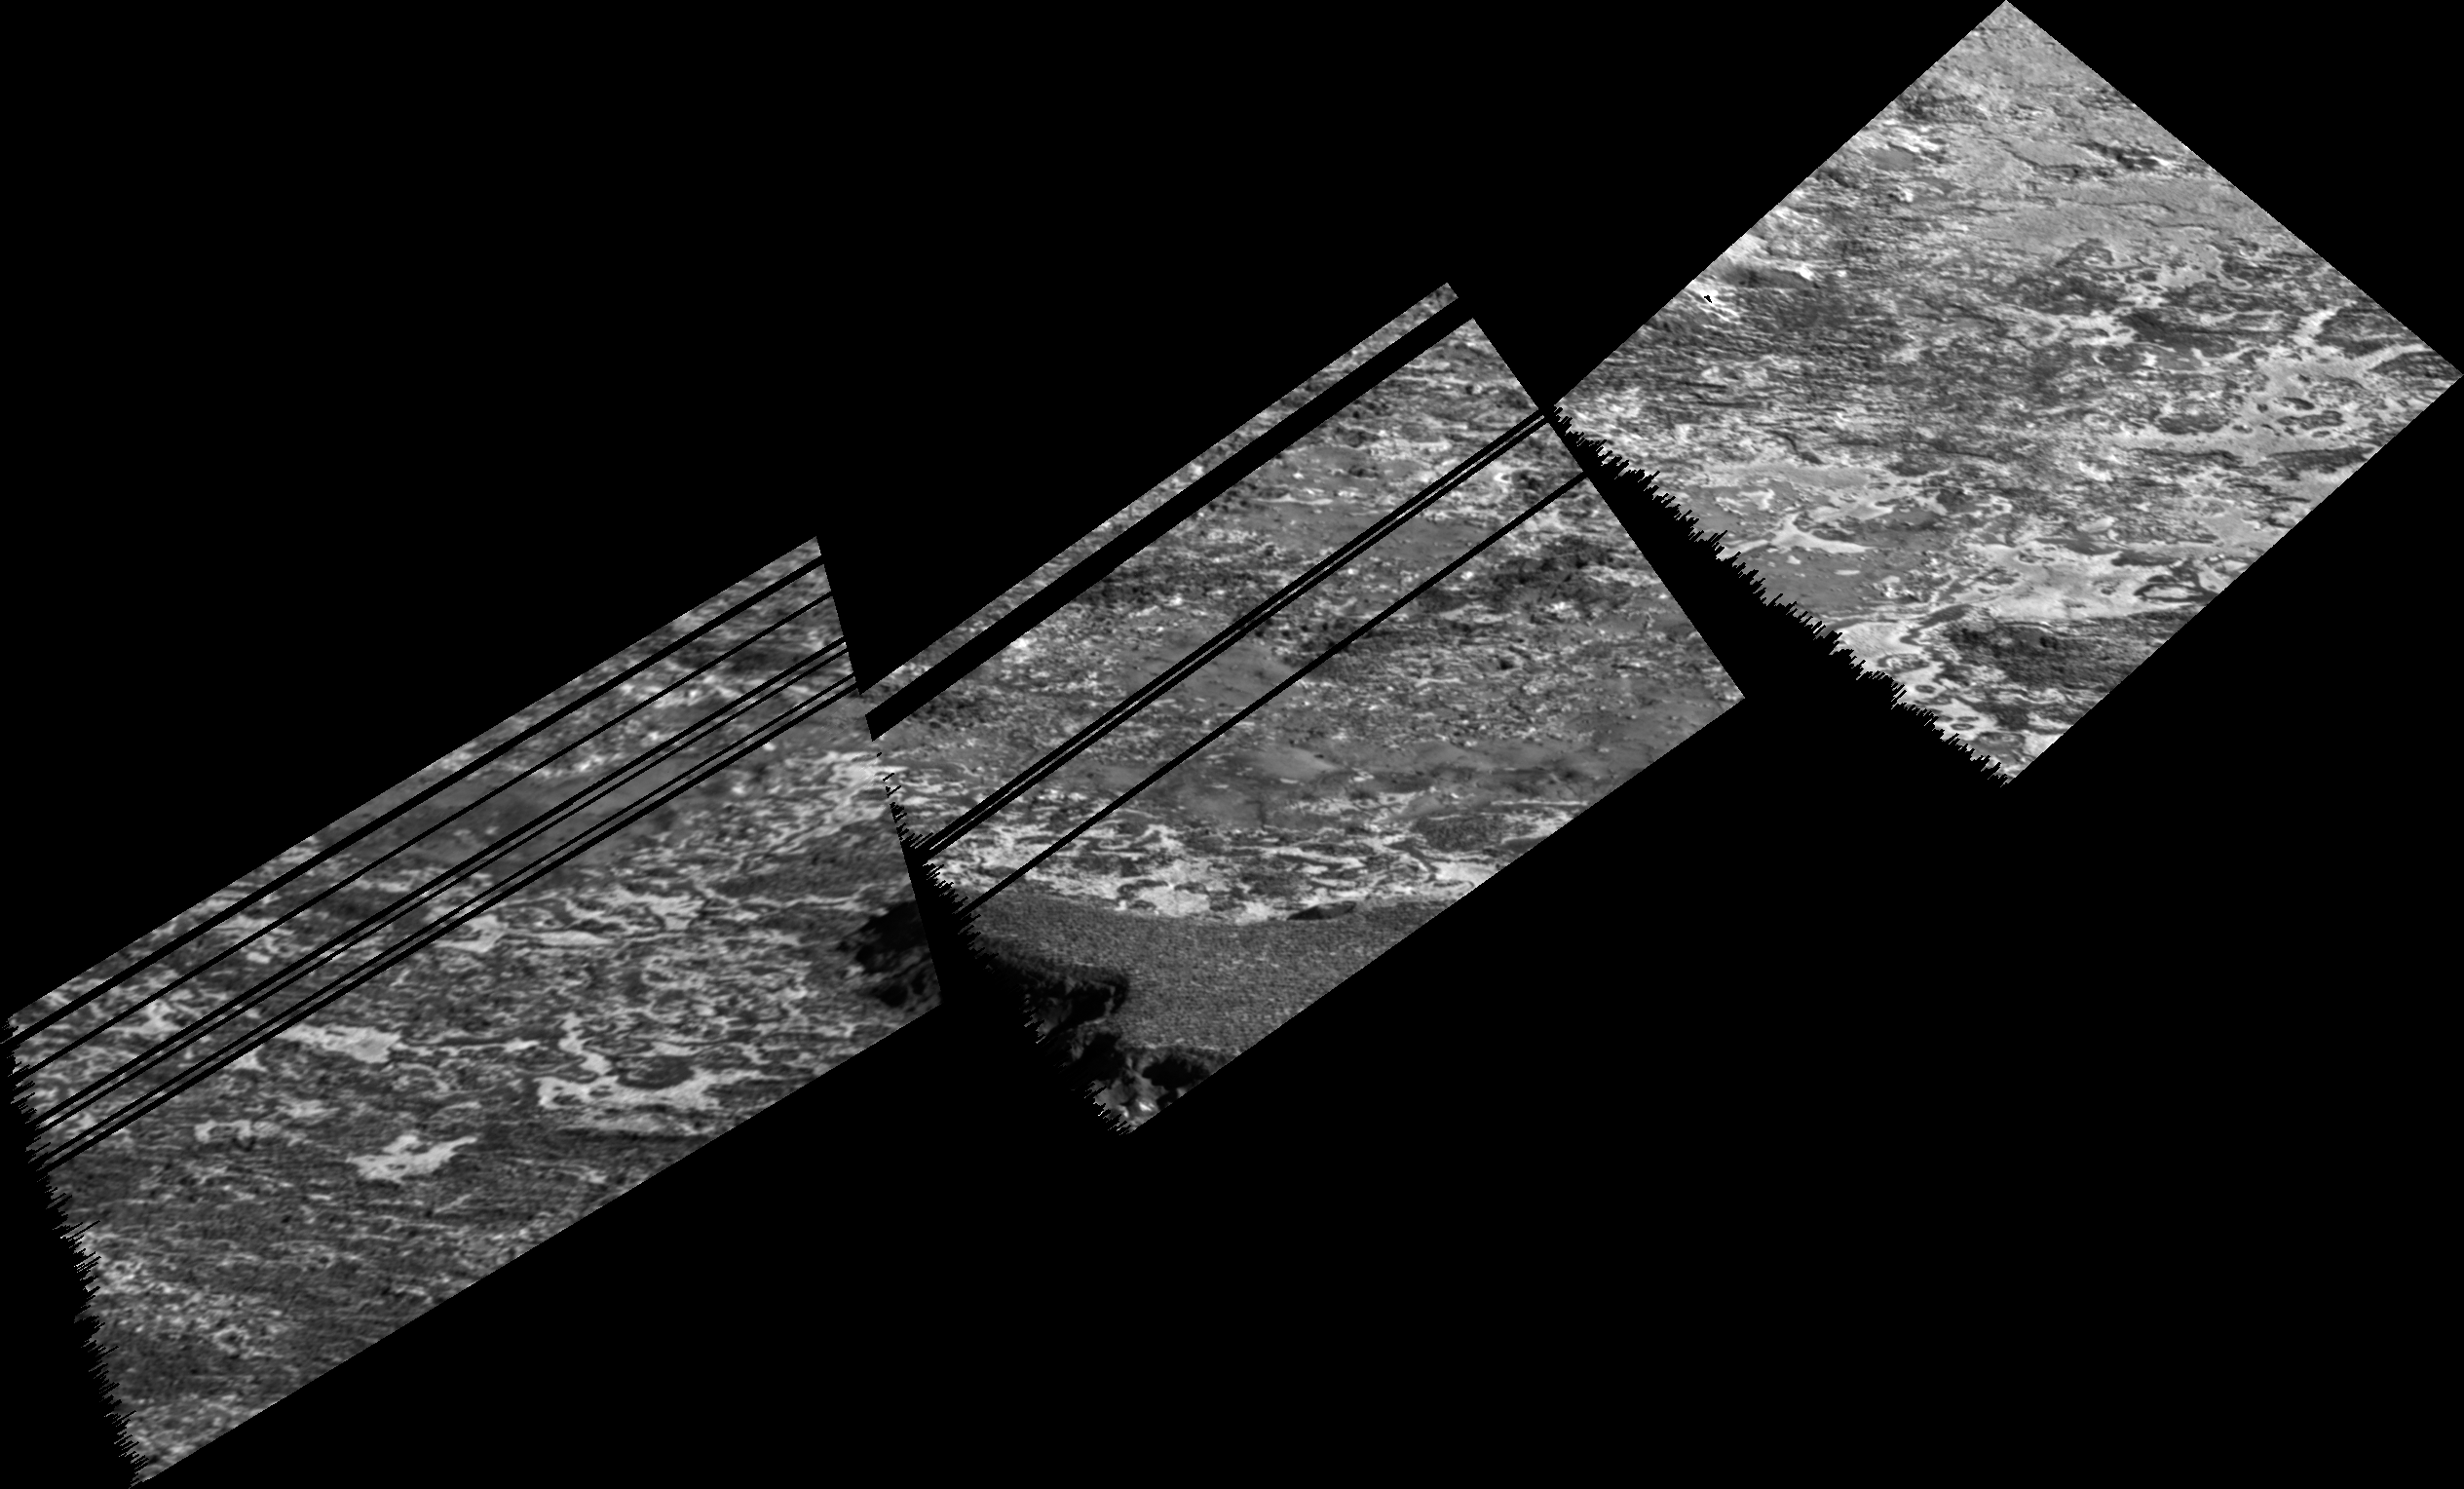
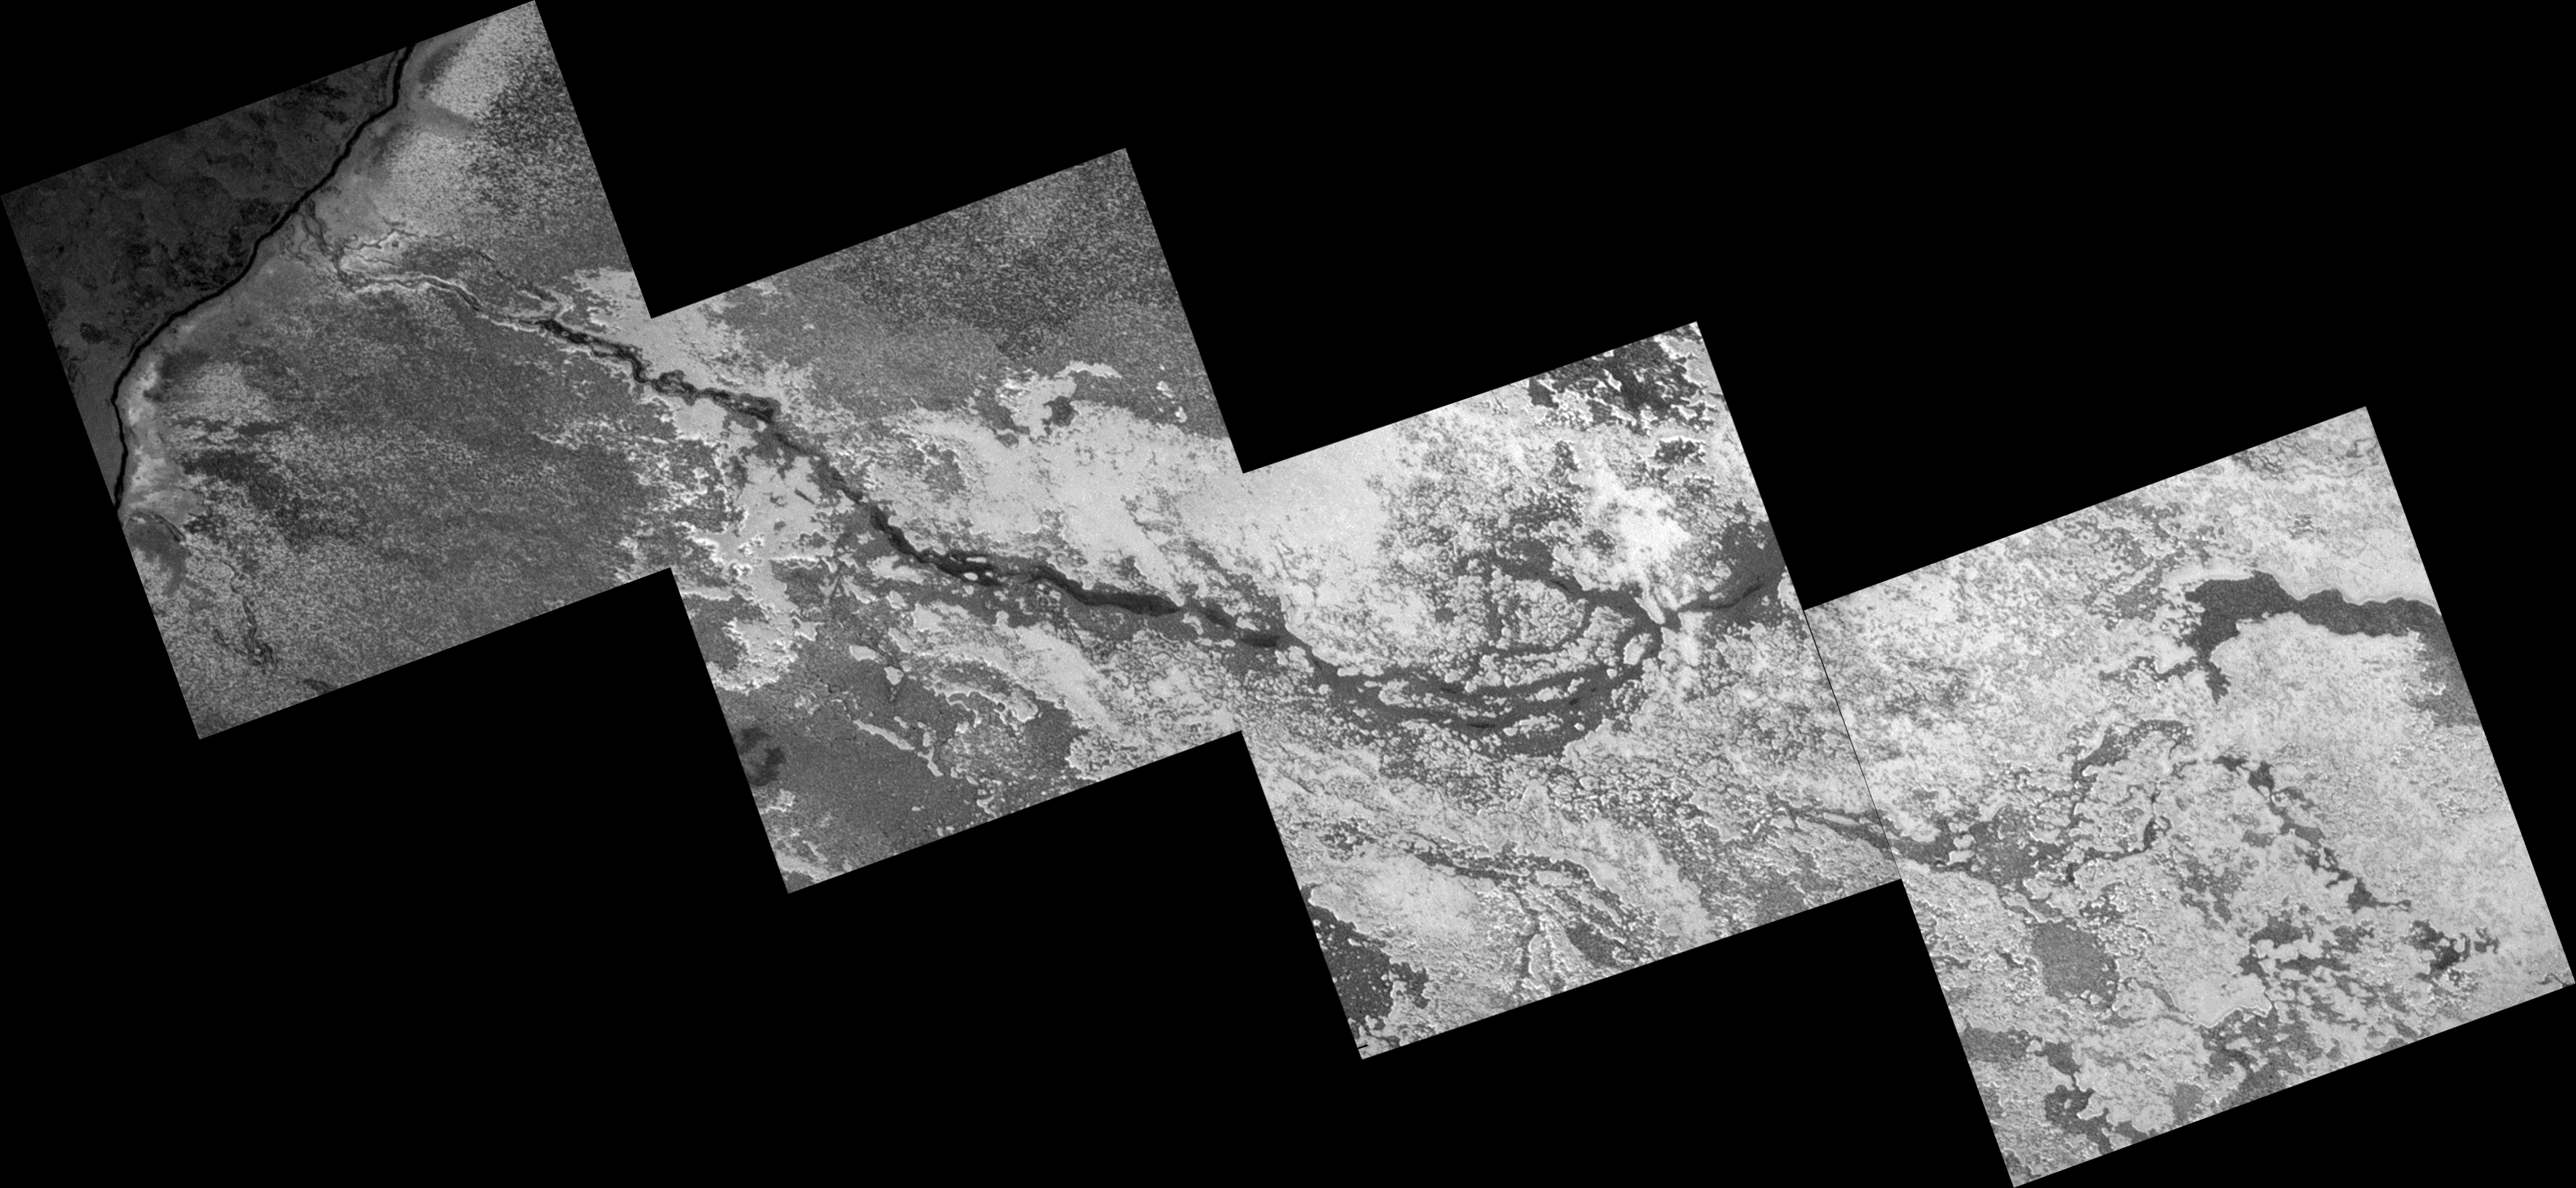
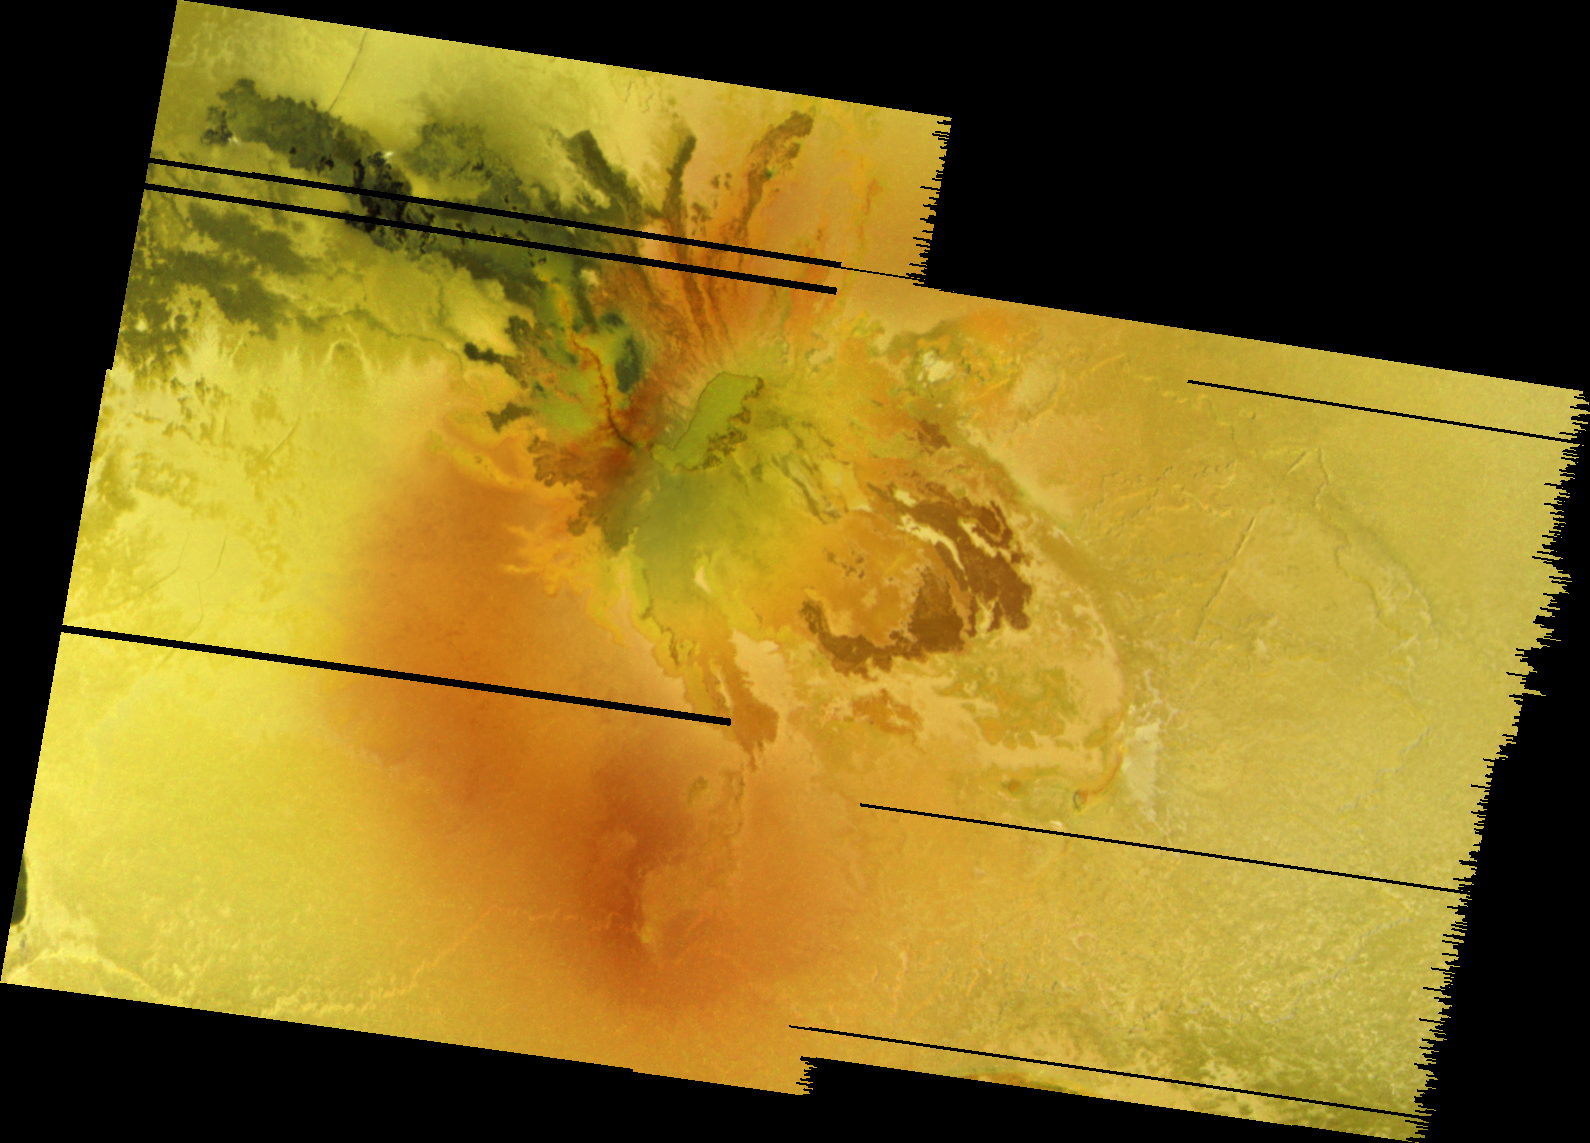
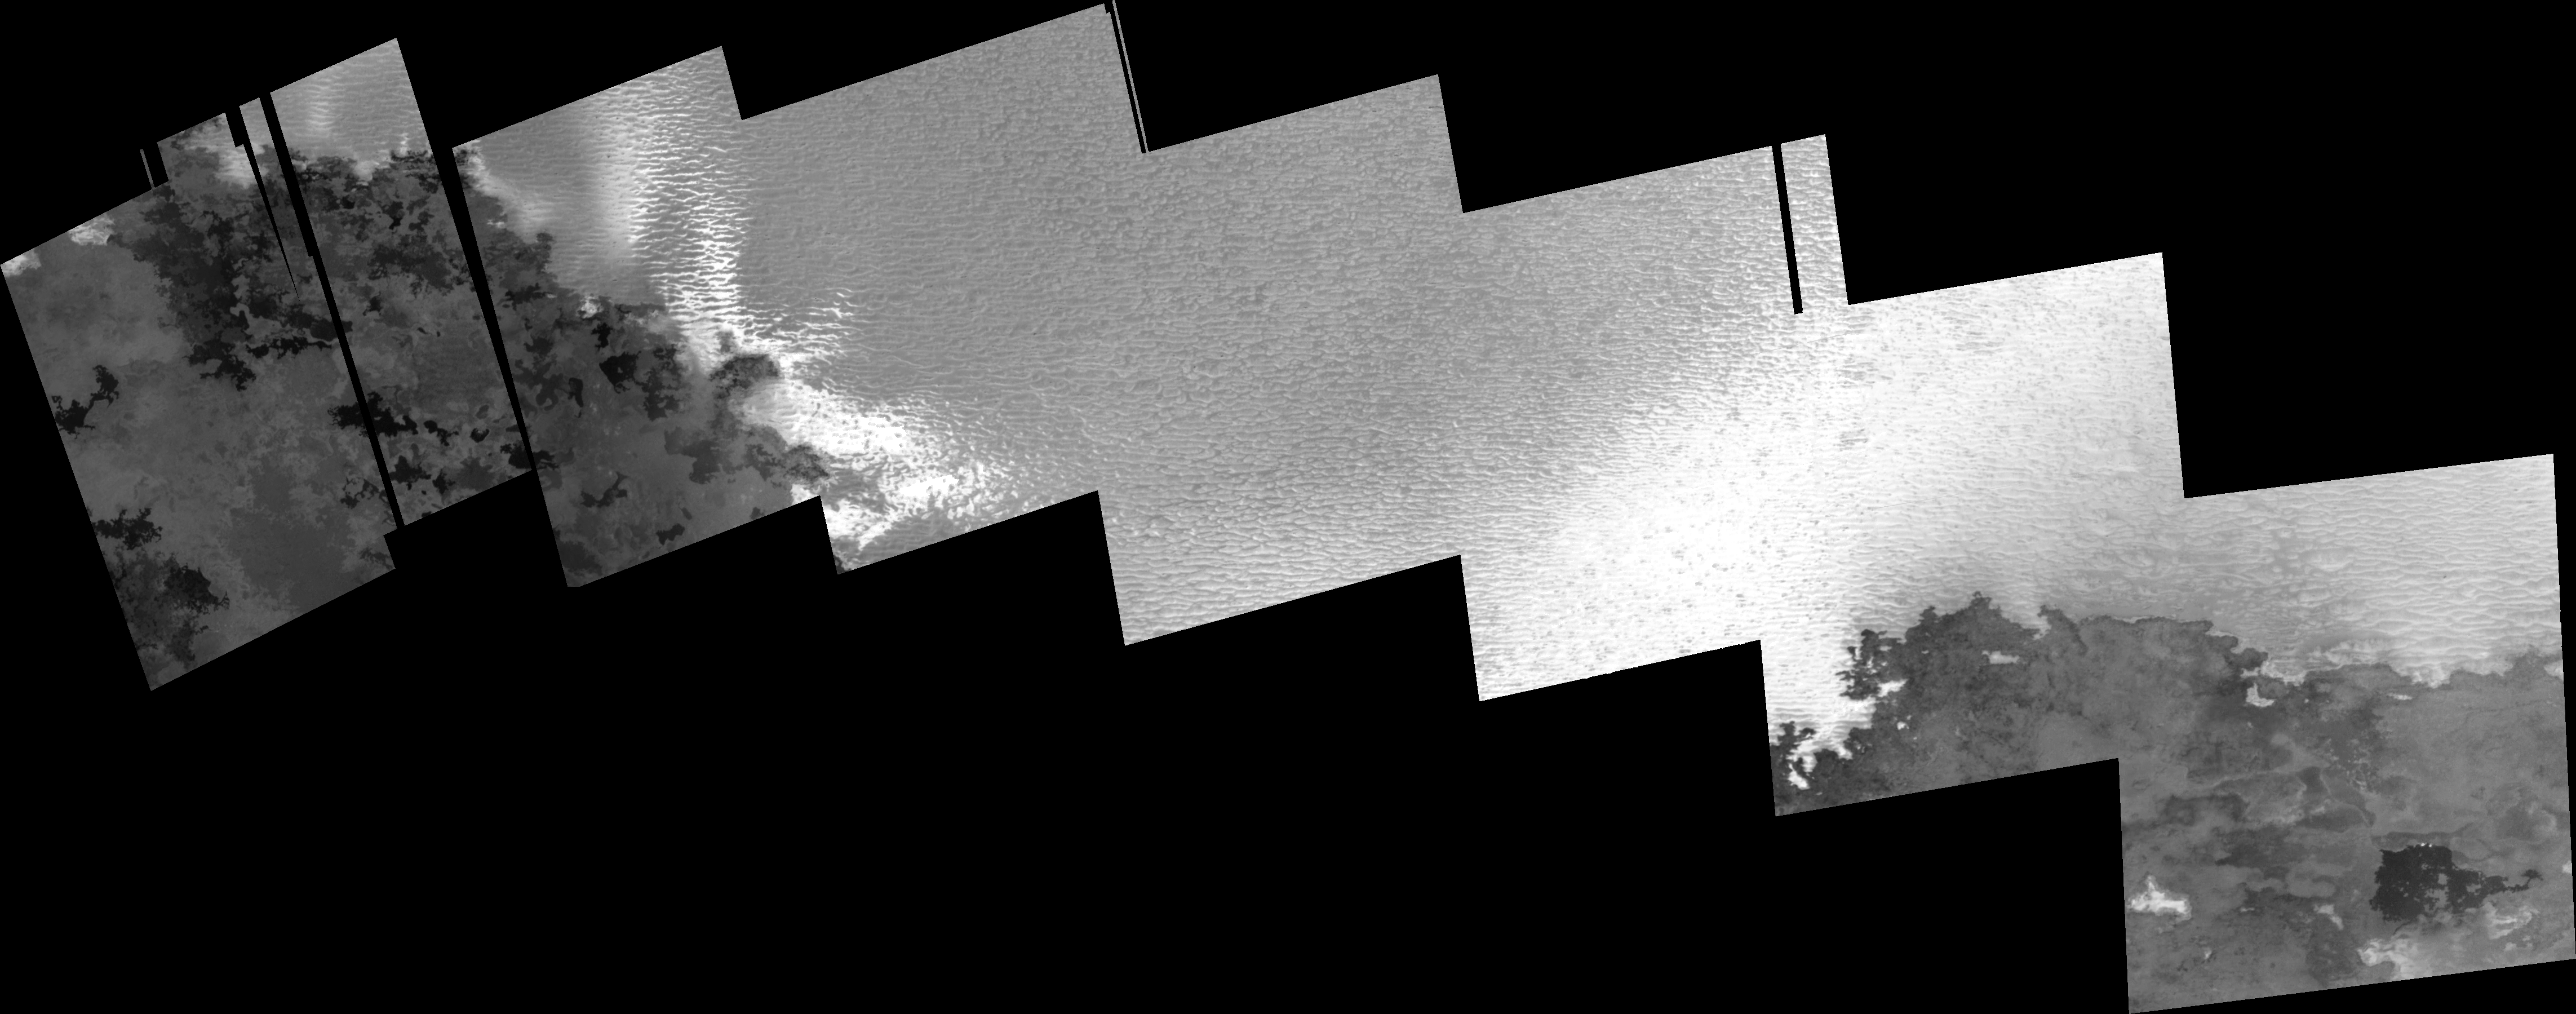
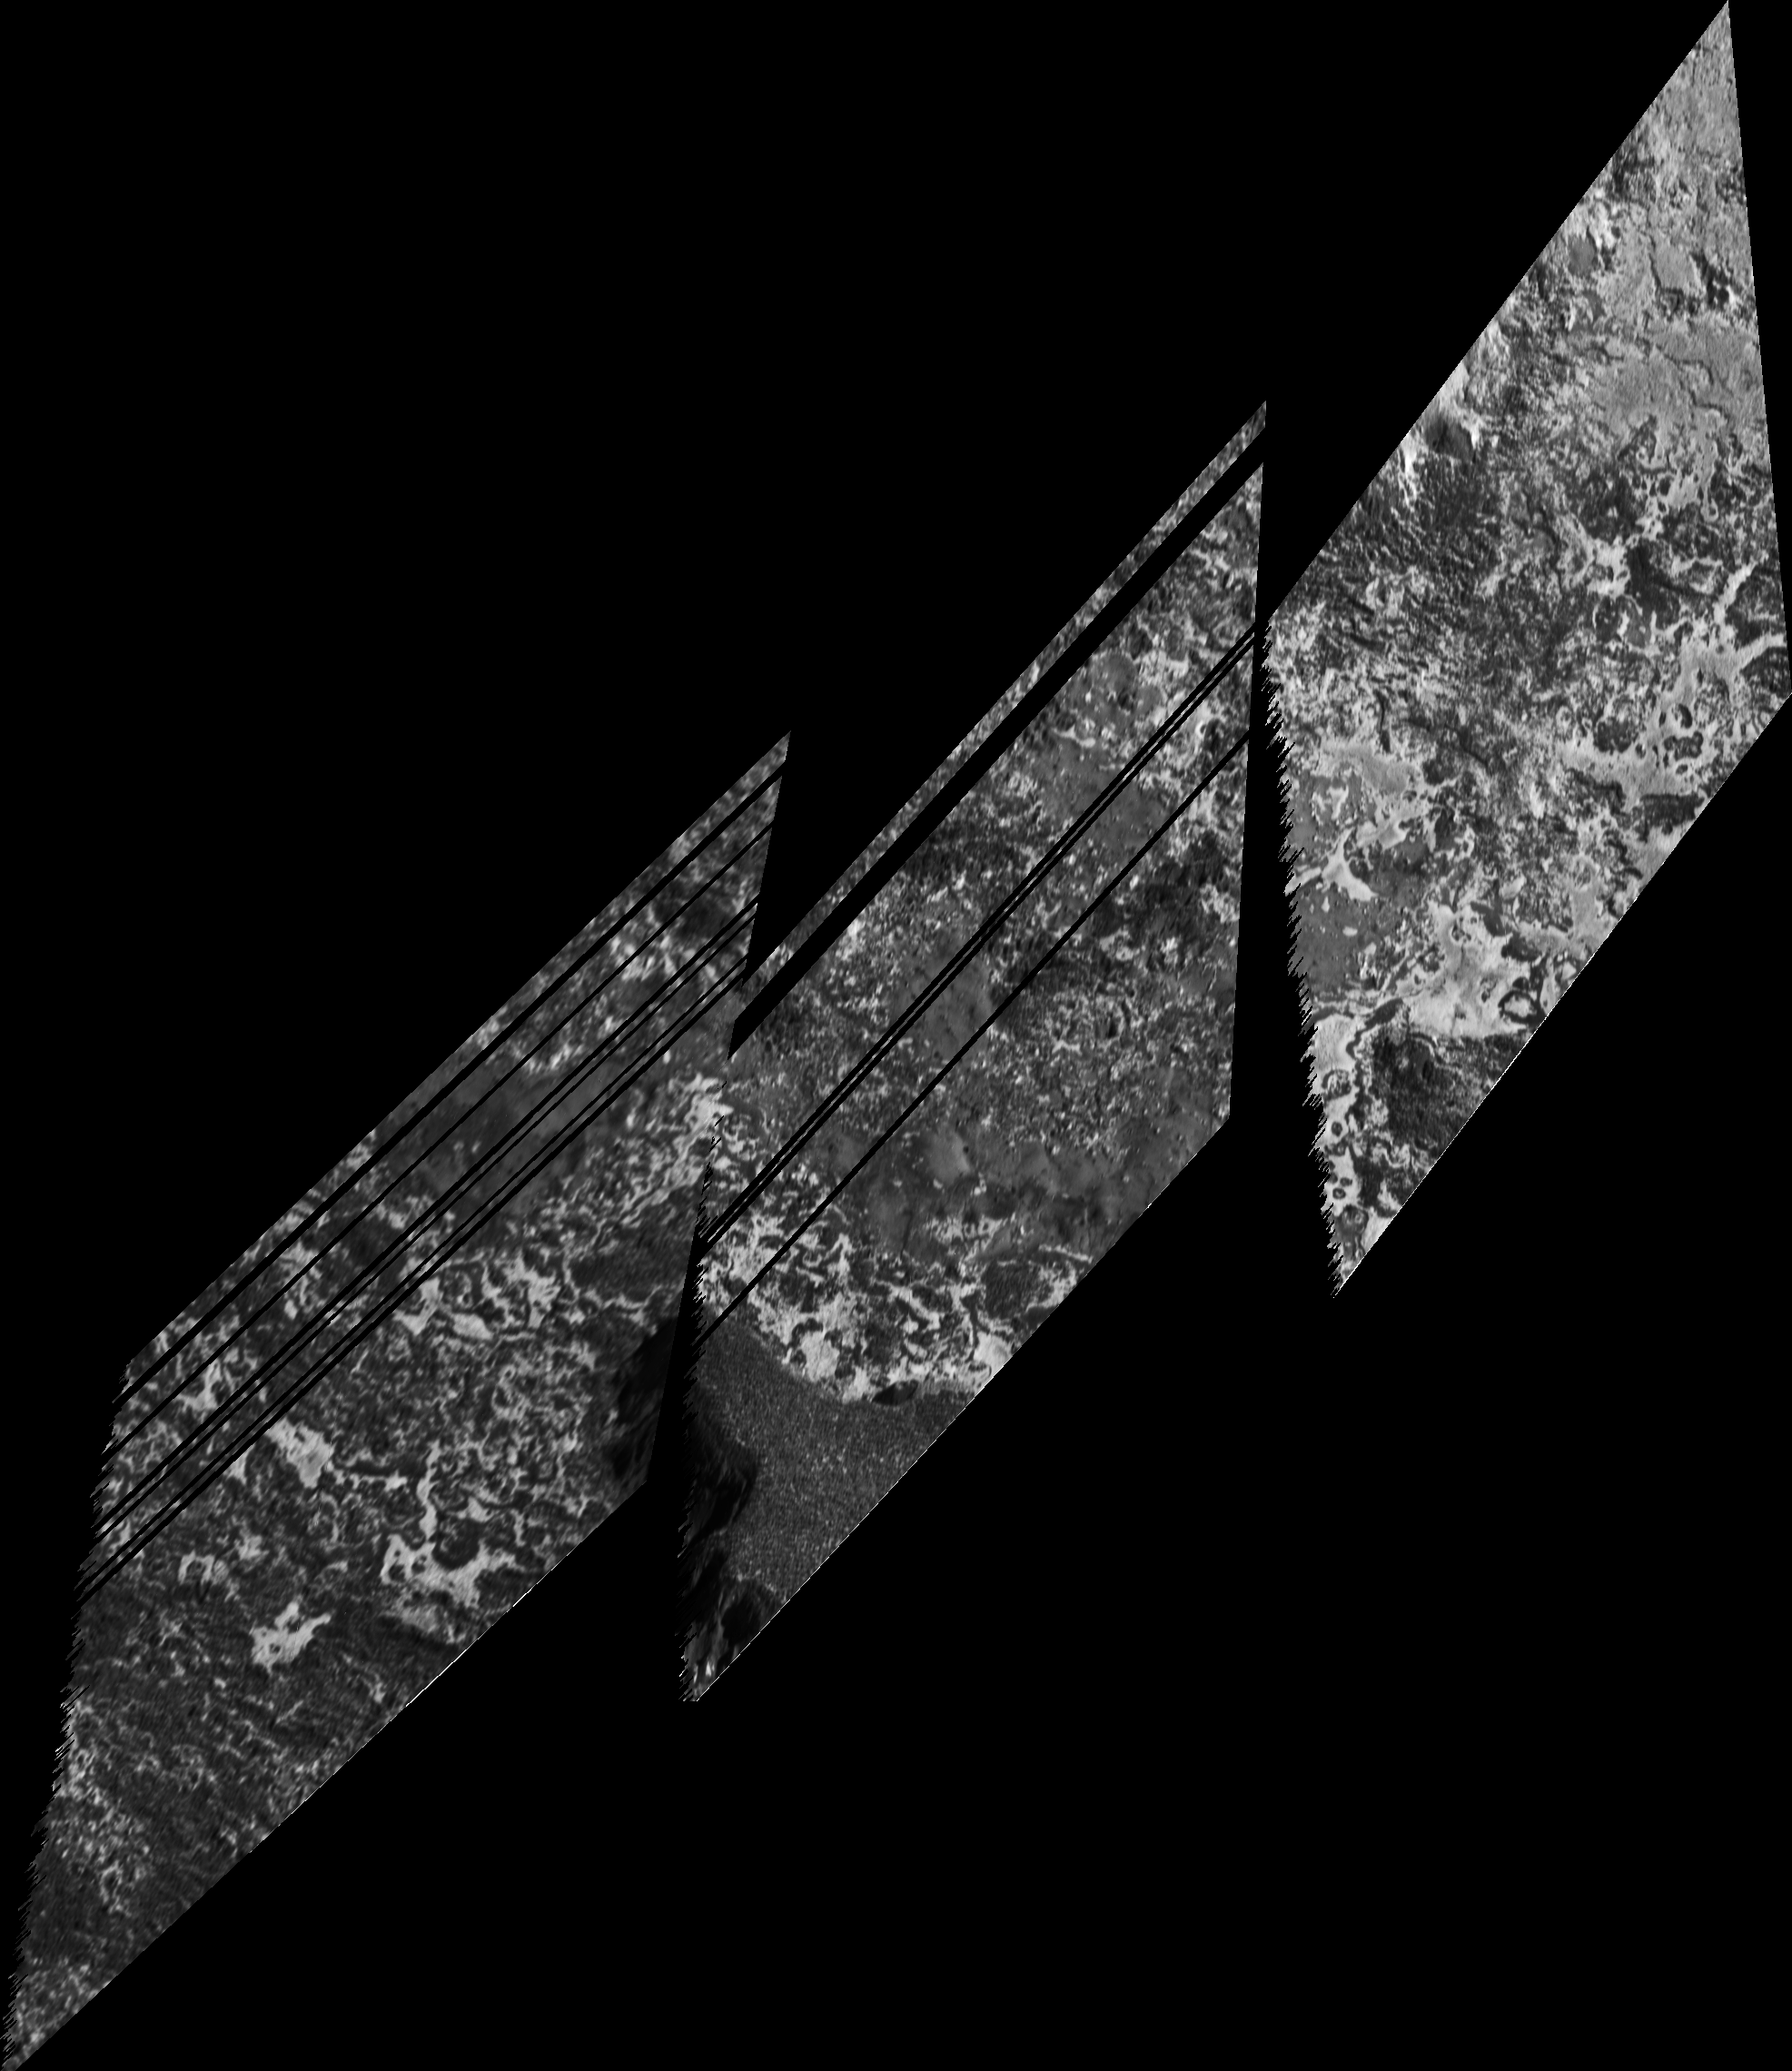
I, for the bazillionth time I swear, have processed the data into a mosaic that you can see above, though you can check out a full-resolution version here.  Like my version of the Chaac Patera mosaic taken a few minutes later, the images have been reprojected into a point-perspective map projection.  This approximates the view Galileo had at the time.  North is just to the left of up in this mosaic, as it has been rotated so north is up.  The perspective is from the point when the middle image was acquired (though I had to adjust the center latitude and longitude to eliminate distortions in the middle image, compared to the sub-spacecraft point reported in the PDS).  Since Galileo was moving rapidly over Io's surface during the observation, the first and third images are a bit distorted compared to the original data in order to match the perspective of the second, with the first images becoming stretched and the third becoming squished.  However, the distortion is not so bad that we can't examine the features seen in the images.

The first problem we face however in interpreting the surface features seen in this mosaic is that we lack proper context.  The images in this mosaic have an effective resolution of approximately 11.6 meters per pixel when you take into account that we are looking toward the horizon rather than straight down at Io.  This more than two orders of a magnitude better than the next best data over this area, shown at left.  This is a clear filter mosaic from October 1999, blown up about three times its original size.  With such a disparity in resolution between the two observations, it becomes difficult to correlate structures seen in both since each of the three I27 frames are 6 pixels across in the I24 data.  The other complication this disparity presents is that we can't tell exactly where the I27 images are in the I24 data.  The pointing was more than a entire SSI field-of-view off from the planned pointing.  From there we can only correct the pointing relative to each other, rather than to any basemap since the next best data doesn't even show the scale of features we seen in the I27 images.

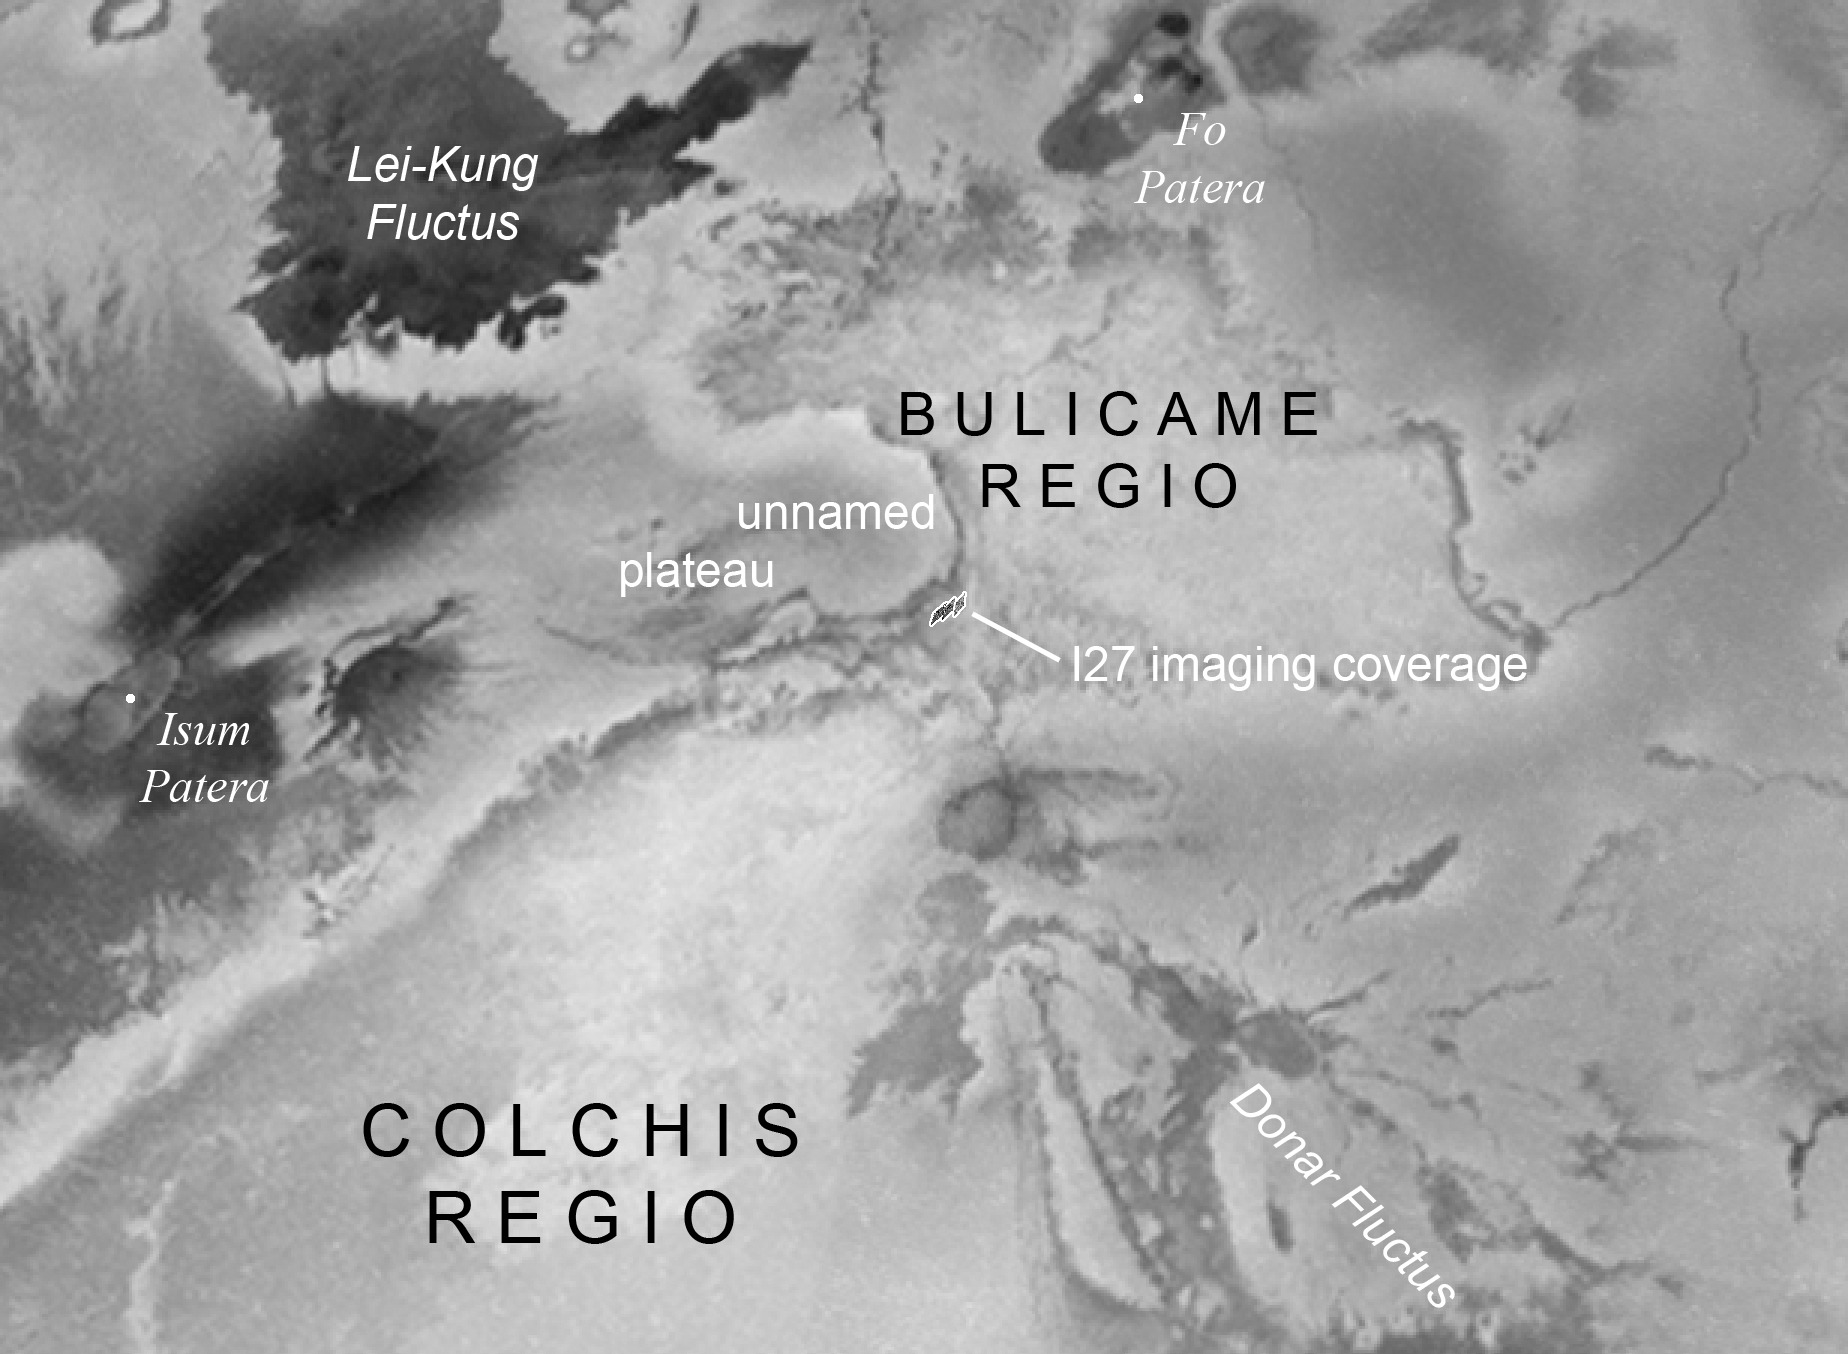
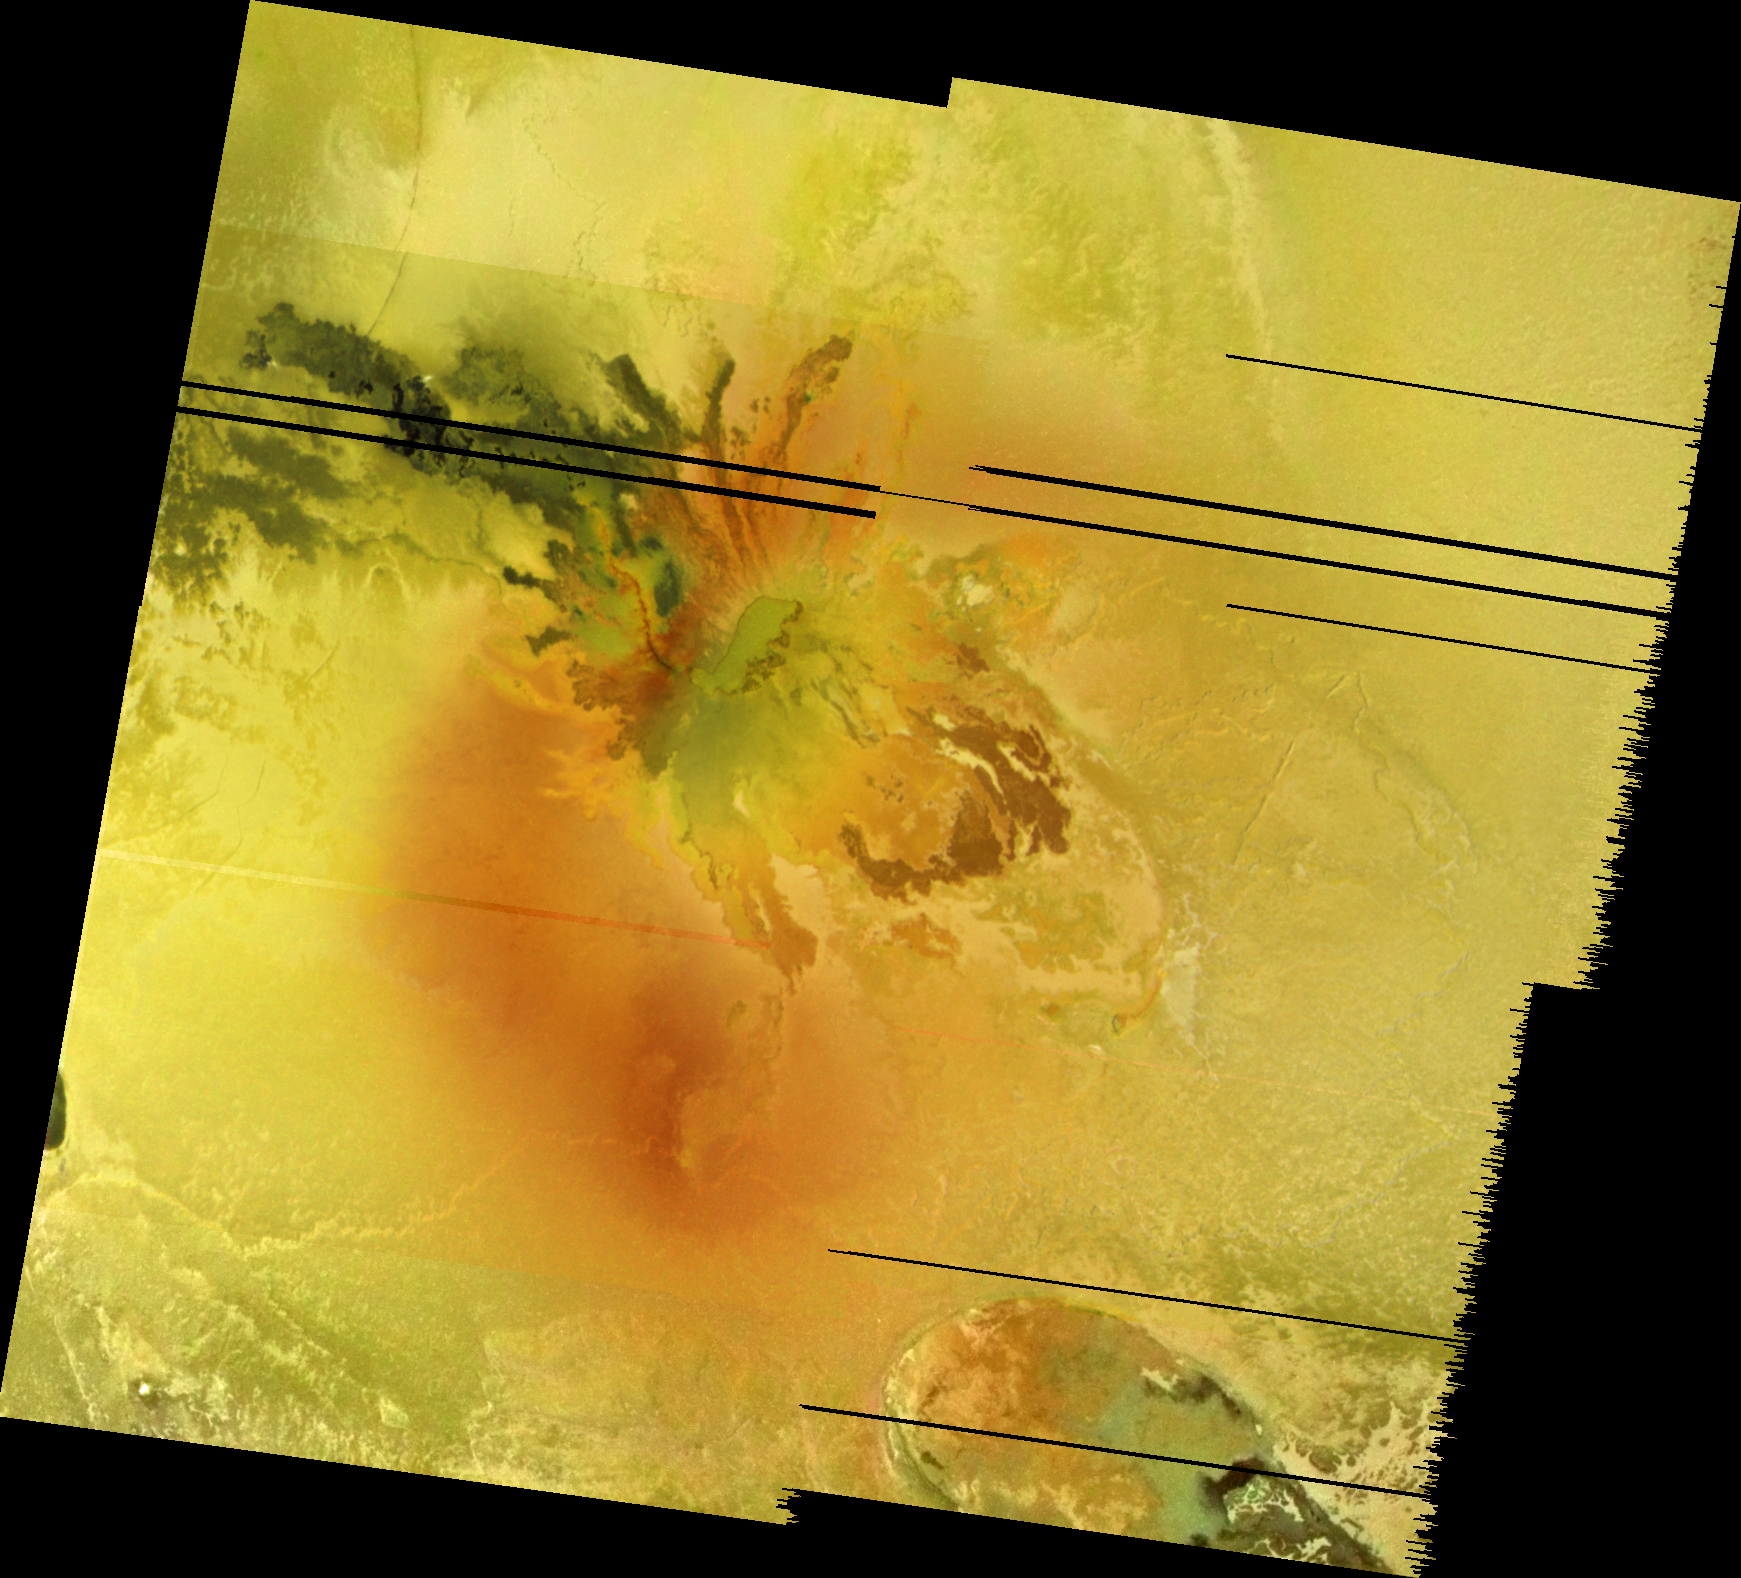
Basically, we don't know how the features relate to the regional geologic context.  We know some basics.  We know that the region we are looking at is a few kilometers southeast of the base of a scarp that bounds a low mesa.  In lower resolution images, this area appears to be a patch work of bright and dark material on the edge of the scarp, perhaps the result of sulfur dioxide-modified lava flows.  At that scale, this imaged area was mapped as bright flows by Williams et al. 2010.  Finally, we also know that there has been recent volcanic activity in this area.

Let's take a look at the features we can observe in this mosaic.   The most prominent feature is a 400-meter-tall mesa at the bottom of the middle frame.  There doesn't appear to be much evidence for layering along the scarp face of this mesa, except for  a 50-meter-thick cap rock.  Surrounding the mesa is a low plain marked by swirls of bright and dark terrain.  Beyond that is region of smoother dark terrain that is marked by large boulders and narrow channels.  Finally, beyond that in the third frame, there is a region of bright and dark layered terrain.

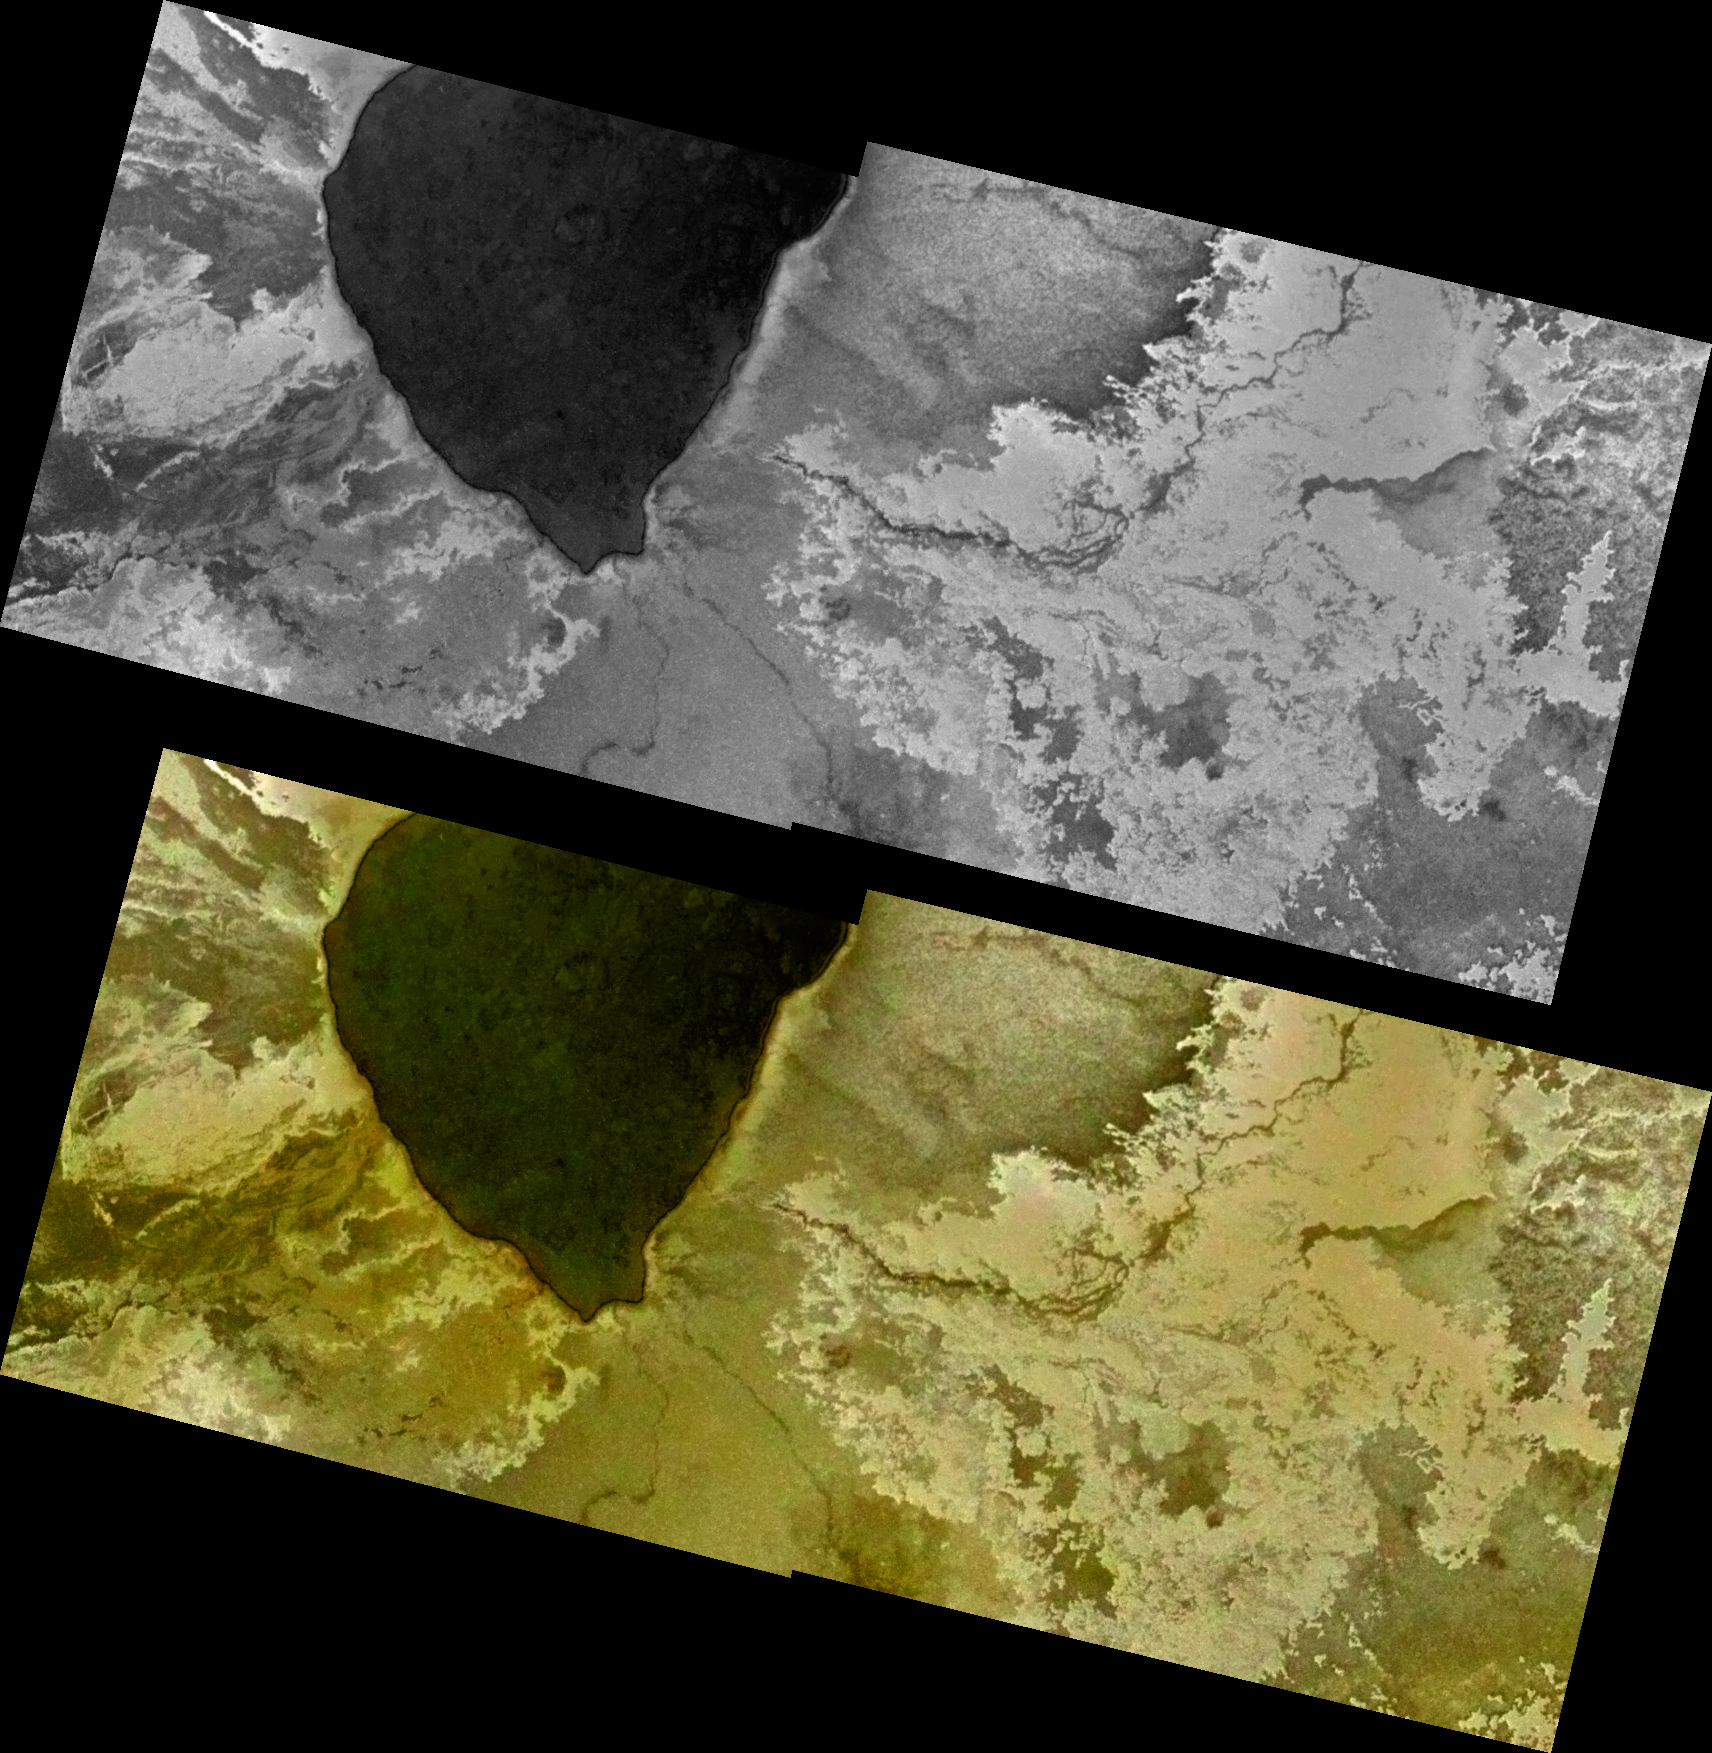
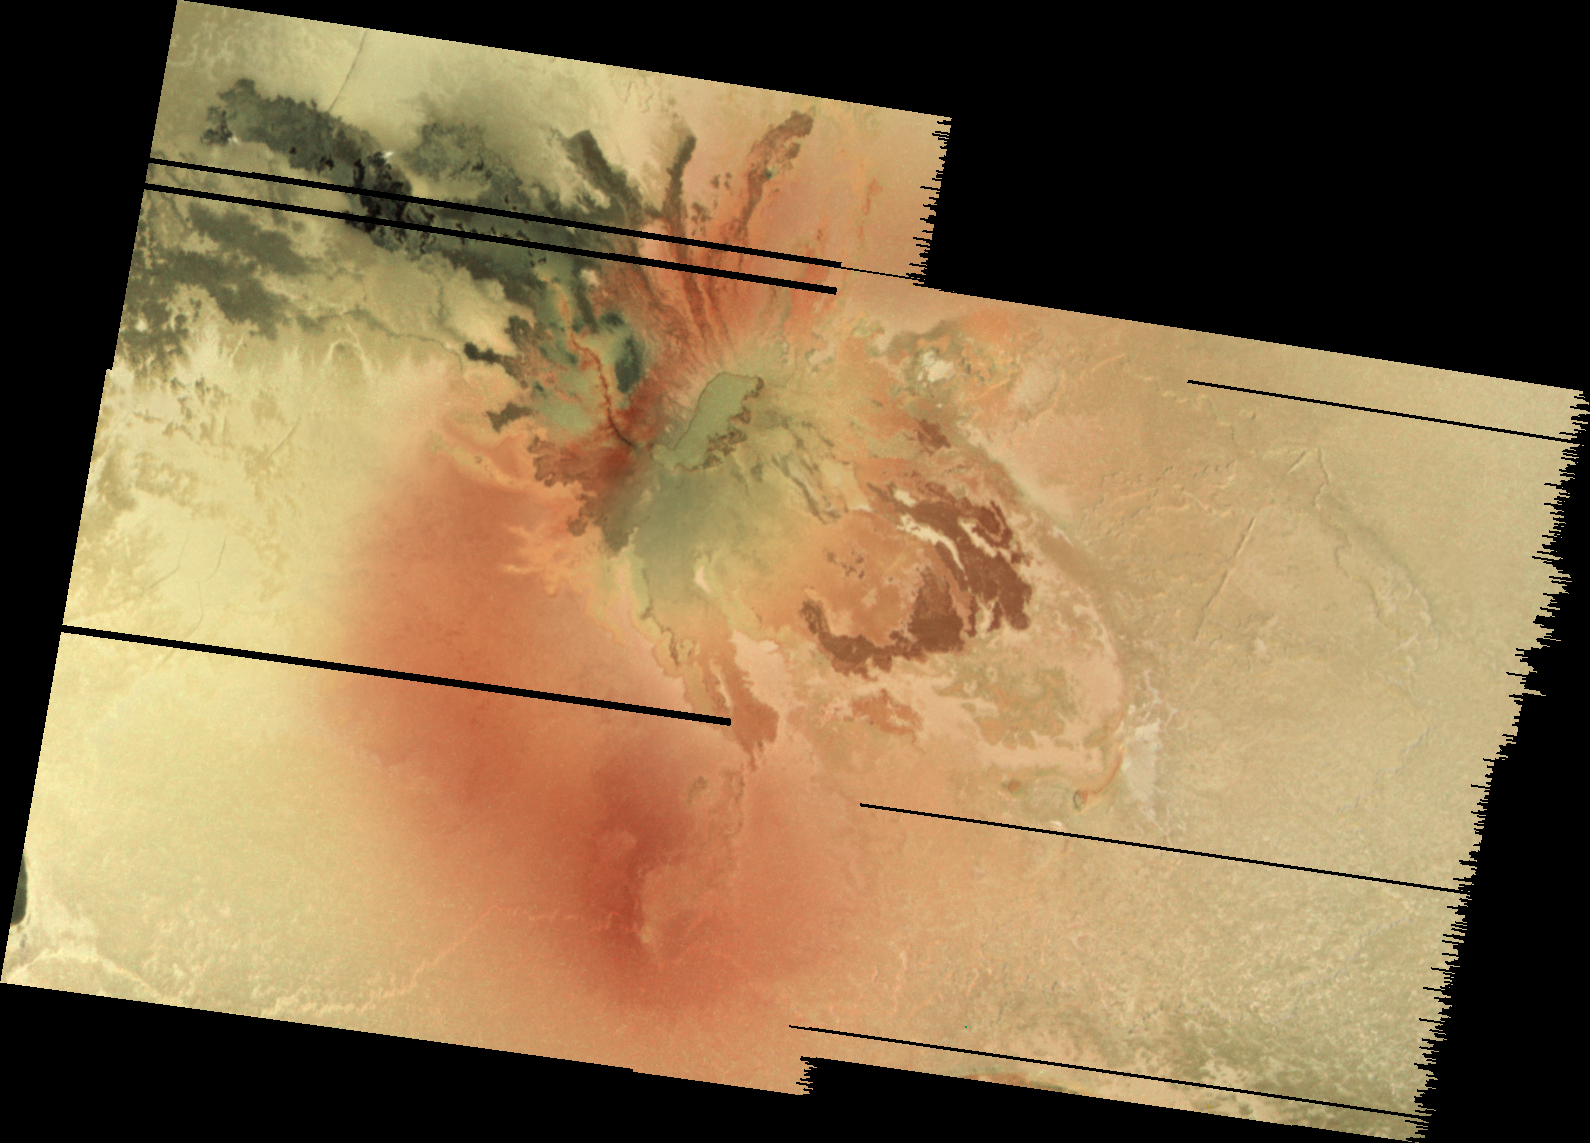
This is certainly quite an enigmatic landscape.  One interpretation provided by Moore et al. 2001 suggests that the mesa was once much larger, but over time sapping has undermined the edge of the mesa, causing it to shrink.  The mottled terrain that surrounds the mesa, filled with bright and dark swirls maybe the area the mesa retreated from.  However, note that this is not the main plateau, which is to the north west of the area covered in these images, and that the mesa seen in the high-res data was not seen in the lower resolution images, suggesting that it isn't much bigger than the what we see here.  I don't think this necessarily changes the story.  On Earth, headward sapping erosion of plateaus have been known to cause portions to be cut off, forming small mesas.  The bright and dark swirls may result from sulfur dioxide filling low areas as it flowed out from the base of the cliff and from fumaroles with the adjacent dark terrain (seen in the middle frame).  Like the water in the gullies on Mars, the sulfur dioxide is boiling as it flows across Io's surface, either escaping to the atmosphere as a gas or freezing as a bright frost in low regions.  The bright/dark mottled terrain appears to follow the shape of the mesa, further suggesting that it is the result of scarp retreat.  As for where the material that made up this scarp went, it is thought that the upper 1-2 kilometers of Io's crust is made up largely of sulfur and sulfur dioxide with cooled silicate existing as layers in the near-surface.  This scarp, and others like it, may then retreat more akin to the polar ice caps on Mars than mesas on Earth, leaving behind only a trace amount of talus near the slope.

Alternatively, the features seen here could be explained by volcanic processes.  After all, this area was mapped as a bright flow from global-scale images.  One of the reasons I wanted to write up this article is that the bright/dark patchwork landscape bears a resemblance to other sulfur-modified lava flow fields seen on the floor of Chaac Patera and to the southeast of Emakong Patera, the latter of which I discussed a couple of weeks ago.  This mottled terrain result again from a similar process as I discussed above: fumaroles on the surface of a cooling lava flow bring up liquid sulfur dioxide where it then freezes in low areas of the flow surface.  However, there don't seem to be any indications of flow lobes in this areas, which you would expect to see if this were once a compound flow field.  This terrain also hugs the base of the mesa, which would you would not normally see since the base of the cliff should be higher topographically that the surrounding plains.  However, the irregular pattern of the mottled terrain at the base of the mesa and the fracture that runs across the middle frame could be the result of the interaction between hot silicate lava and volatile sulfur dioxide.

In February 2000, Galileo imaged a very enigmatic landscape at high resolution.  The terrain seen in these images has been difficult to interpret due to the lack of proper context imaging of this region.  The difficulty in interpreting this data forced a change in the imaging strategy for later flybys as super high-resolution observations were dropped and other sequences with resolutions similar to this mosaic were accompanied by lower-resolution images taken at later in the encounters to help interpret small-scale features.  However, this lack of regional context doesn't make the features seen here any more interesting or make us less capable to at least speculate as to what caused this mess, whether it was erosion from sulfur dioxide sapping, volcanic lava flows, or fumaroles leaving behind frozen sulfur dioxide.

References:
Turtle, E. P.; et al. (2001). "Mountains on Io: High-resolution Galileo observations, initial interpretations, and formation models". Journal of Geophysical Research 106 (E12): 33175–33199.
Moore, J.; et al. (2001). "Landform degradation and slope processes on Io: The Galileo view". Journal of Geophysical Research 106 (E12): 33223–33240.

Thursday, August 26, 2010

The Errata of the Day

Happy Thursday everyone! Only one more day till Friday...  Just thought I would post a few quick notes:
  • Jupiter and the Moon are particularly close tonight in the late evening and night sky.  The simulated view to the right shows the sky to the southeast at around 11:06pm local time (since the moon is moving slowly across the field of background stars, YMMV).  And nothing special happens right at 11:06pm, that's just when I pressed stop in Celestia ;-) The close proximity of the Moon to Jupiter (and Uranus) makes it a bit easier to locate those planets, so it is worth taking a look, even for those who don't have telescopes (like myself).  Jupiter is approaching opposition, which occurs on September 22.  On that date, Jupiter will be opposite the Sun from the Earth, meaning the planet (and its attendant moons) will rise over the horizon at sunset, reaches its highest point in the sky at local midnight, and set below the horizon at sunrise.  This is also the best opportunity to observe Jupiter because it will reaches its largest size in the night sky.  In fact, this will be Jupiter's closest approach to Earth than at any other time between 1963 and 2022.
  • The Carnival of Space #168 is now up over at Weird Sciences.  Read up on Trojan kuiper belt objects, bistatic experiments on the Moon, and the Laser Interferometer Space Antenna (LISA).  I submitted my write up on a method for creating true color images of Io for this week's Carnival of Space.
  • Emily Lakdawalla of the Planetary Society Blog is this week's featured Woman in Planetary Science.  I'll admit, I never read that blog much because, well, I'm not a woman in Planetary Science.  But after reading a few of the profiles, I see that many of the experiences are pretty universal, and can be useful for both men and women who are considering a career in this field.

Wednesday, August 25, 2010

"Io" Episode of Wonders of the Solar System on TV Tonight

Just a quick reminder to my readers in the US that the "Io" episode of the Science Channel mini-series, Wonders of the Solar System, is on tonight at 9pm EDT/6pm PDT. An encore presentation will air at 12am EDT/9pm PDT in case you missed it the first go around. The five-part series, a production of the BBC, is hosted by Brian Cox, a particle physicist from the Univ. of Manchester. The show aired back in its home country earlier this year. The episode is actually titled, "Dead or Alive", and the topic up for discussion is planetary geology.  In addition to the extensive discussion of Io's volcanism, the episode also focuses on volcanism on Mars, Venus, and the Earth as well as impact cratering on the Earth.  If you get the Science Channel (preferably in HD) from your cable, fiber optic, or satellite TV provider, then I would definitely recommend checking it out tonight.  The last episode, which airs next Wednesday, will focus on the potential habitability of Europa and Mars and the influence water has had in shaping many of the worlds of our solar system.

To get a feel for what to expect, one of the people on the BBC Two film crew who produced the series posted some behind the scenes videos on Youtube from the shoot at Erta'ale in Ethiopia:


All I will say is that people who put on gas masks for just a wee bit of sulfur dioxide are silly! Come on! That sulfuric acid that is created in your lungs will put hair on your chest! You wouldn't see Morgan Freeman using a gas mask if he did one of his Wormhole shows from Erta'ale. And in the second video, I have that book! Not the Ethiopia one, the other one! I even wrote a review of it a couple of years back.

One other reminder is that the series will be coming out on Blu-ray and DVD on September 7. Not sure if these are the BBC Two versions that will be released in the US, as they are about 15 minutes longer due to the lack of commercials breaking up the fun.

Io Volcano of the Week: Culann

This month for my Io Volcano of the Week series, we are looking at volcanoes that were observed at moderate resolution (160-280 meters or 525-920 feet per pixel) during Galileo's I25 flyby of Io on November 26, 1999.  Over the last three weeks we have looked at Zal, Emakong, and Hi'iaka, three large paterae - volcanic depressions - on Io's leading hemisphere.  This week we take a look at Culann Patera.  Like Emakong, the green-colored patera is surrounded by a number of distinct lava flows of varying surface colors and ages.  The most recent of these flow lobes formed between 1979 and 1996, along with a number of other changes at Culann between how it appeared during the Voyager flybys and the Galileo mission.  Unlike Emakong, lava temperatures measured at Culann by the Galileo spacecraft are clearly in the silicate range, suggesting that the colored lava flows are a surface coating after they had cooled, rather than the result of sulfur volcanism.  It is also the site of a faint, dust-poor plume, observed by Galileo in 1998, though a fairly distinctive plume deposit was seen by the spacecraft.

Culann Patera was first observed in Voyager 1 images.  It is located 600 kilometers (375 miles) south-southwest of the active volcano Prometheus at 20.2° South, 160.2° West.  The spacecraft observed dark lava flows surrounding the small patera (not seen by Voyager due to the low resolution) with a narrow flow lobe extending out to the northwest of the main flow field before turning west.  The darkest of the flows seen by the Voyagers was to the southwest of the patera that was later seen by Galileo.  The volcano was named by the IAU in 1979 after a blacksmith from the Ulster cycle of Irish mythology.

Culann was next observed by Galileo 17 years later.  Its first images of the region were taken in September 1996, revealing a number of changes as a result of volcanic activity in years between observations including fresh silicate lava flows and a reddish plume deposit.  Many of the flows that were dark in 1979, suggesting they were active at the time, had brightened by September 1996, meaning they had cooled enough to permit sulfur and sulfur dioxide to condense on them.  NIMS detected a thermal hotspot at Culann during this encounter and through 75% of the observations of this region during the nominal mission, showing that the volcano remained active throughout the Galileo mission.  A small, faint plume may have been detected in September 1996 (which could have been the source of the new reddish deposits at Culann), along with a gas plume seen while Io was in Jupiter's shadow in May 1998.

Details on the style of volcanic activity at Culann would come during Galileo's flybys of Io in late 1999 and 2001.  Lower resolution color data from throughout the Galileo mission showed that Culann Patera was host to a variety of colored terrains, with green, red, and yellow colored lava flows and plains in close proximity.  As a result, the imaging team targeted the volcano for a medium resolution, two-by-two frame, color mosaic during Galileo I25 encounter on November 26, 1999.  I've processed the images that were returned into the three mosaics below.  All three use orthographic projection with a scale of 206.3 meters (676.8 feet) per pixel.  The first is a mosaic of the red, green, and violet frames returned from the 25ISCULANN01 observation [high-resolution version available].  Only those areas covered by all three colors are included.  The second mosaic covers the same area as the first, but the blue channel uses a synthetic blue filter image created using the method I described last week [high-resolution version available].  The third mosaic includes the area from the first mosaic, but includes the rest of the green filter data from the 25ISCULANN01 observation [high-resolution version available].  This additional data was colorized using data acquired in July 1999.
These images revealed that Culann Patera was a shallow, green floored depression, seven kilometers (4.3 miles) by 23 kilometers (14.3 miles) in size.  Both the patera and the region surrounding it (particularly to the south and east) are coated with green material, and this greenish terrain is in turn surrounded by a 150- to-170-kilometer-diameter (93 to 106 mile) ring of red deposits (that was a bit more distinctive to the east of Culann Patera earlier in the Galileo mission).  Many of these deposits coat an overlapping set of lava flows that radiate out from the patera.  A curved, dark red line runs for 42 kilometers (26 miles) from the southwest end of the patera toward the northwest, growing fainter the farther northwest it goes.  It terminates in the proximal  end of Culann's darkest and youngest lava flow fields, which run another 75 kilometers (47 miles) to the north west.  Multi-colored, older lava flows are seen to the southeast of Culann Patera.  These correspond to the darkest flows seen by the Voyager spacecraft in 1979.  These lava had flowed into a shallow depression that is surrounded by low, etched mesas.

Comparing these images to a regional mapping observation taken in October 2001 reveal a number of changes within this dark flow field, suggesting that like Prometheus, it is a compound flow field that is built up by fresh, darker breakouts of lava.  One suggestion provided by Keszthelyi et al. 2001 is that the curved, red line seen running northwest of the patera is a lava tube that brings lava from the source at the patera to the flow field.  The reddish material that marks the location of this lava tube may result from sulfurous gases escape through skylights on the roof of the lava tube that then condense on the colder plains nearby.  Lava flows through this lava tube from its source at Culann Patera to the lava flow field, where it spills out into first small breakouts in the medial portion of the dark flow field, then larger areas of warm, dark lava toward the distal end of the field.  This idea is supported by high resolution near-infrared spectrometer data, which revealed two hot spots within the Culann volcanic system.  The brightest hotspot is located over the dark flow field due its large exposures of recent lava.  A smaller thermal hotspot is located at Culann Patera, the source of the lava flows in this region.  The long length of the flows radiating out from it suggest that the lavas they are composed of had a very low viscosity, as there is very little difference in altitude between the margins of Culann Patera and the surrounding plains, based on stereo images by Galileo.

The colors seen at Culann are thought to be result of the interaction between sulfur and silicate lava.  When sulfur, emitted from the source vent at the patera or from the main active lava tube, condenses and lands on the surface, it normally creates a reddish deposit on the surface.  The size of the deposit is the result of the temperature of the escaping gases and the vent pressure.  Given the size of the red deposit at Culann, both factors are likely to be less than at Pele, which has a red ring plume deposit more than a 1,000 kilometers (600 miles) across.  When this sulfur condenses on Io's cold plains (~120 K/-244° F), this produces a red deposit.  When it lands on warm lava, the sulfur is thought to interact chemically with the iron in Io's lavas to produce greenish iron sulfide, or pyrite as it is known in its mineral form.  A few bright white spots are seen along portions of the current flow field to the northwest of Culann Patera.  These result from the interaction between cold sulfur dioxide frost on Io's surface and hot, silicate lava that flows over it.  The lava vaporizes the frost, which then condenses on the cold ground outside the flow field, or on older, colder areas of the flow field (gradually brightening the flow as it ages as more SO2 frost and sulfur is deposited on it).

The color observation of Culann Patera in November 1999 allowed researchers to examine the relationship between different color units seen all across Io's surface.  They revealed a complex interaction between sulfurous gases, emitted either from the primary vent or from re-volatilization by flowing lavas, and the terrain these gases land on.  They also provided further evidence for how large lava flow fields develop, an idea that seems to be back up at other sites like Prometheus and Amirani.

Next week, we will take a look at the target of Galileo's 25ISGIANTS01 observation, Tvashtar Paterae.

References: 
Williams, D.; et al. (2004). "Mapping of the Culann–Tohil region of Io from Galileo imaging data". Icarus 169: 80–97.
Geissler, P. E., M.T. McMillan. (2008). "Galileo observations of volcanic plumes on Io". Icarus 197: 505–518.
Lopes-Gautier, R.; et al. (1999). "Active Volcanism on Io: Global Distribution and Variations in Activity". Icarus 140: 243–264.
Keszthelyi, L.; et al. (2001). "Imaging of volcanic activity on Jupiter's moon Io by Galileo during the Galileo Europa Mission and the Galileo Millennium Mission". Journal of Geophysical Research 106 (E12): 33,025–33,052.

Monday, August 23, 2010

Follow-up on Friday's Impact on Jupiter

As I reported yesterday, Japanese astronomer Masayuki Tachikawa recorded on video the impact of a small asteroid or comet on Jupiter's northern hemisphere on August 20 (early August 21 in Japan).  The optical flash of the meteor streaking across the Jovian sky was also seen by two other Japanese astronomers, Kazuo Aoki and Masayuki Ichimaru.  Both astronomers imaged Jupiter, again using webcams connected to their telescopes, during the impact event and recorded the optical flash of the fireball.  Kazuo Aoki's recording allows a more precise estimate of the timing of flash to within a second of 18:21:56 UTC on August 20.  Having more than observation of the event provides a confirmation of the observation and eliminates other potential sources of the flash, such as nearby artificial satellite.

Isshi Tabe has a webpage up where he is collecting the observations from various astronomers across the western Pacific of this impact event.  More information on the methodology of these observations as well as links to images and videos can be found on his website.

Kelly Beatty reports over at the Sky and Telescope website that Imke de Pater and Heidi Hammel were also observing Jupiter using the 10-meter Keck II telescope in Hawaii. They did image the impact region during their two-day run, but in their initial look at the data, they didn't see anything new such as an impact scar. The impact occurred when the Sun was already up in Hawaii, so they most likely didn't observe the actual impact.

As I pointed out yesterday, this is the second fireball to be seen in Jupiter atmosphere this year, after only two previous impact event seen from Earth, in 1994 and 2009 (though the latter was only seen after the impact).  This doesn't mean that impact events are somehow occurring more frequently.  The discoveries this year are helped by the method many amateur astronomers use to record their observations and built up high-quality images.  Because they tend to use smaller telescopes than most professionals, they are limited by the amount of light their telescopes can collect.  This lowers the signal-to-noise of their observations.  Increasing the exposure times is fine for faint targets, but for bright targets like Jupiter, that will just over-exposing the data, limiting their usefulness.  Instead, they use USB cameras (webcams) to record video of their target of interest at 20-60 frames per second.  Software is then used to stack the numerous frames they record to build up images with a much higher signal-to-noise ratio than each separate frame.  This is akin to how we take images of Titan's surface, where we acquire 3 images of Titan's surface at 938 nanometers and then sum them on the ground.  These webcam videos, taken by numerous amateur astronomers from around the world also have the side benefit of allowing them to detect transient events like meteor fireballs in Jupiter's atmosphere, which would have been difficult to detect otherwise.  With so many amateur astronomers taking long videos of Jupiter, the likelihood that an impact event is detected is improved.

On that note, I want to repost something the head of the Jupiter section of the Association of Lunar and Planetary Observers, John Rogers, sent around today on the potential of this data set:
It would really be worth determining the frequency of these events. Some ideas:
1) Regular observers: Please can you tell me: On a typical night, how many minutes of video do you record and look through?
2) From now on, could regular observers record the start and end times of video they view each night, and could anyone volunteer to collect this information? Perhaps regional associations (ALPO, ALPO-Japan, etc.) might be able to collect this info? I hope this would not be a burden for observers -- Obviously it is wonderful when you process and send the best of your images as soon as possible, and I certainly would not ask you to delay until you have completed the paperwork! A list of video times sent once a month would be fine. But it would be worthwhile, so the amateur observers' network could make an important measurement of the frequency of these events
3) Maybe someone could devise software for scanning the webcam videos and identifying these fireballs automatically??
With these measures in place, perhaps more impact events will be recorded and detected going forward. This information will scientists to estimate the impactor flux in the Jupiter system. With some modeling, this can further improve our age estimates for the surfaces of Io and Europa.

On Isshi Tabe's website, he also points out that Christopher Go found a reference to a Voyager 1 observation of a fireball.  The paper is by A. Cook and T. Duxbury and is titled, "A Fireball in Jupiter's Atmosphere".  It was found while the spacecraft was eclipsed by the Sun, shortly after the Io encounter on March 5, 1979. The Voyager narrow-angle-camera was using this opportunity to image Jupiter's night-side with limited contamination from sunlight to search for lightning and meteor fireballs.  They were able to find one fireball, in Jupiter's high-northern latitudes, with an absolute magnitude of -12.5 and a path length of 75 km (image c1639630 from 03/05/1979 17:45:24 UTC).  Cook and Duxbury mass of the impactor was 11 kg. Assuming an impact velocity of 64 km/sec., the flash occurred over a period of 1.17 seconds, which is on the same order as the meteors seen this year from Earth.  From their observations, they suggest that the number density for objects larger than 3 kg is a factor of 6 less than the estimate obtained from terrestrial meteors.  Additional modeling and observations from ground-based telescopes should help to pin down this estimate.

Link: Isshi Tabe - Fireball on Jupiter in 2010 20th August UT [yokohama.cool.ne.jp]
Link: Paper - A Fireball in Jupiter’s Atmosphere [dx.doi.org]

Sunday, August 22, 2010

Meteor fireball spotted in Jupiter's Atmosphere - Again

Remember a time when Jupiter only had 16 satellites?  Or when the only extra-solar planets know where a trio around a pulsar and a recently discovered handful?  Or when the only known impacts on Jupiter seen by astronomers (or its after effects) were the Shoemaker-Levy 9 impacts in 1994?  I do.  Sometimes in science, once a discovery is made or observation recorded, it unleashes a torrent.  First, one new moon is discovered out beyond Callisto (Themisto) in 1999, then another, then another at Saturn, and the next thing you know, both Jupiter and Saturn have 60+ known moons.  Same for extra-solar planets, we've found so many, they are merely just part of a statistic for the Kepler team.  Last July, amateur astronomers found an impact site on Jupiter, formed after an asteroid struck Jupiter's southern hemisphere. Then this year, on June 3, astronomers Anthony Wesley and Christopher Go spotted a meteor impact the planet's upper atmosphere, burning up before it could leave its own mark on the solar system's largest planet.  Well, it has happened again.

On Friday, August 20 at 18:22 UTC (Saturday morning in Japan), Japanese astronomer Masayuki Tachikawa detected an optical flash, likely from a meteor striking Jupiter's upper atmosphere using a Philips Toucam Pro2 USB camera attached to his telescope.  The impact is the first to be seen over Jupiter's northern hemisphere, occurring on the northern edge of the North Equatorial Belt (south is up in the image above) just to the east of the Great Red Spot's longitude.  A detailed report on the discovery can be found over at the ALPO-Japan website (scroll down to the bottom for an English description of the observation).  A video of the optical flash can be found on that site as well, though I found it best to save the file first before playing it.  A French description (the first link I saw with this news, posted by Eric Soucy, tip o' the hat to him for this news) can be found at Ciel et Espace.

The ALPO-Japan website also has images from after the impact, taken yesterday.  So far there doesn't appear to be any evidence for an impact scar, like the June 3 fireball.

Anyways, soon, observations of meteors in Jupiter's atmosphere will be just statistics used to determine the current impact flux in the Jupiter system...

UPDATE: Nick Previsich found a great English language link describing how this discovery was made from the Sky and Telescope's website.
Another Update: Two more excellent blog posts from Daniel Fischer and Emily Lakdawalla (who has a Youtube version of the optical flash video up) I would remiss to point out.

UPDATE 08/23 2:38 am: Thanks to Kelly Beatty and Emily Lakdawalla for pointing out some independent confirmation that this optical flash is in fact an impact on Jupiter.

Link: Optical flash on the surface of the Jupiter by M.Tachikaw [alpo-j.asahikawa-med.ac.jp]
Link: Another Flash on Jupiter? [www.skyandtelescope.com]
Link: Offenbar schon wieder ein Impaktblitz auf Jupiter von Amateur gefilmt [skyweek.wordpress.com]
Link: Yet another Jupiter impact!? August 20, seen from Japan [www.planetary.org]

Friday, August 20, 2010

The Remains of the Week

I just wanted to fire off a quick post with other Jupiter/Io-related news that is hitting the intertubes this week:
  • The Carnival of Space, hosted here last week, is hosted this week for the 167th Edition over at Space Tweeps, a group of Tweeters who post quick space news on Twitter.  A couple of posts that caught my eye include one from Paul Schenk showing off some new videos he created using topography and color data from Cassini and another from the IAG Planetary Geomorphology Working Group discussing hematite-rich regions on Mars (like the area Opportunity is sprinting across this week).
  • We are approaching next month's once-every-13-months alignment with Jupiter known as opposition.  As we get closer to the opposition on September 22, many amateur planetary astronomers are pointing their scopes up at Jupiter to catch the best views of the planet on offer this year. One of my favorites showing Jupiter with Io is this one at right from Anthony Wesley, an astrophotographer out of Australia (who is best known for discovery not one but TWO impacts on Jupiter).  It was taken on Wednesday from Exmouth, Western Australia.  You can find more images of Jupiter by astronomers from around the world over at the ALPO-Japan and from the Cloudy Nights forum.
  • I want to thank Emily Lakdawalla for re-publishing my post on Io's true-color processing.  She even dug up a nice chart showing the spectral curves of the cones in your retinas :)
  • Finally, Björn Jónsson created a nice, 12-frame color mosaic from Voyager 1 data of Jupiter.  Very nice!  I hope he posts more.
Link: Carnival of Space #167: The Space Tweeps Edition [spacetweepsociety.org]
Link: ALPO-Japan's Jupiter Section [alpo-j.asahikawa-med.ac.jp]

Thursday, August 19, 2010

Honey, I Shrunk the Moon!

Today at a press conference at NASA HQ in Washington, DC, scientists from the Lunar Reconnaissance Orbiter Camera (LROC) team announced their discovery of lobate thrust fault scarps on the surface of the Moon that indicate that not only has the Moon's radius shrunk by 100 meters, but it has done so in geologically recent times.  High-resolution images of these scarps show that they cross-cut small impact craters, which would normally be removed over hundred-million-year timescales by thermal cycling of the soil by the moon's month-long day, solid body tides from its gravitational interaction with the Earth, and micrometeorite impact gardening.

What would cause such shrinking?  When the moon was formed out of the impact of a large planetoid into the infant Earth, it initially was molten.  Over time the crust and core solidified, but its mantle still contained a large amount of molten silicate magma.  Magma from this "magma ocean" on occasion reached the Moon's surface, filling many of its large impact basins, creating the dark mare basalt regions.  Over time, the Moon's mantle cooled and solidified as a result of reduced heating from radioactive elements, conduction through the Moon's crust, and the removal of hot magma through volcanism.  Now as you may remember, for most materials, the phase change from a liquid to a solid causes a change in the density of the material.  For silicate magma, the density increases, so for a given amount amount of magma, the volume will decrease when it solidifies.  When this occurs on a planetary scale, such as a the Moon or Mercury, as the interior of the planet cools and solidifies, the planet or moon shrinks.
When this shrinking occurs, the crust of the planet must accommodate it.  After all, when the volume decreases, the surface area also decreases.  This causes compression within the crust which can be taken up by compacting loose surface material or reducing pore space, or through thrust faulting.  Thrust faults are low-angle faults that allow the surface above the fault to be pushed up on top of the rock beneath it. The surface expression of thrust fault on the Moon or Mercury is a arcuate scarp.  Examples of these scarps are shown above from the Moon (shown on the left side of the side-by-side image above from LROC data) and from Mercury (shown on the right).  The lunar scarps are smaller than their Mercurian cousins, rising only 100 meters above the surrounding terrain at most, with the majority only rising a few tens of meters.  On Mercury, like Beagle Rupes shown above cutting across the oblong Sveinsdóttir crater, these scarps are much than those found on the Moon, often rising a kilometer or above the surrounding terrain.  Their height, length, and estimated horizontal displacement suggest that Mercury may have contracted by several kilometers.  MESSENGER images will be used to date these scarps to determine when this shrinkage occurred just as the LROC group has done.

The situation is a bit different for icy bodies.  Unlike silicates, when water solidifies its density decreases and volume increases when it freezes.  So the radius of icy bodies increases rather than shrinks like rocky worlds like the Moon and Mercury.  The equivalent feature to the lobate scarps of the rocky bodies formed from this expansion are the narrow extensional fractures that criss-cross ancient worlds like Tethys, Dione, and Rhea.  The image at left, taken last Friday by Cassini, shows a pair of narrow fractures that cut across Penelope, an ancient impact basin on Saturn's moon Tethys. These fractures suggest that these worlds have expanded as a result of the solidification of water in their interior more recently than the heavy bombardment that produced the plethora of impact crater visible in scenes like the one at right.  Like the work being performed at the Moon and Mercury, finding and mapping these fractures and measuring the amount of displacement they accommodated will tells us how much these moons have expanded (and thus how much of their interiors remained molten until comparatively recently) and approximately when, based on superposition relationships with impact craters.

Now this wouldn't be an Io-centric blog without pointing out that the lobate thrust fault scarps seen on the Moon and Mercury are puny when compared to equivalent features on Io.  Now, obviously, unlike those two geologically dead(ish) worlds, Io is much more active and its mantle still has a large melt fraction.  Its volcanoes dredge up enough material every year that it could cover the entire surface of Io in a layer one centimeter thick (though the amount of resurface varies greatly from place-to-place).  These centimeters add up, and after a million years, the surface of Io is covered in approximately 10 kilometers (6.2 miles) of cooled lava, sulfur, and sulfur dioxide (though some of this material is locally recycled, so 10 km maybe an upper limit).  This has the effect, for the present-day surface, of shrinking the radius of Io by 10 kilometers in one million years.  As a result of global subsidence, thrust faults drive up massive "lobate scarps", also recognized as the mountains of Io.  Two clear examples of this are shown at left, Gish Bar Mons and Euboea Montes.  Both mountains reach 8-10 kilometers above Io's surrounding plains.  Of course, this may be an over-simplified model for how Io's mountains form, so I would recommend reading my article on various formation models for more information on the details.

This study of lunar lobate scarps highlights the need for global high-resolution studies, whether we are talking about the Moon, Mars, Mercury, or Io, as LROC images allowed researchers to assess the global population of these cliffs. Once their true distribution was determined, they could then come up with a proper model of how they formed. This provided an important glimpse to the Moon's recent geologic activity, after the formation of the mare basalts.

Link: NASA's LRO Reveals 'Incredible Shrinking Moon' [www.nasa.gov]

Exposing Io's True Colors

Thanks to its active volcanic activity and sulfur-rich surface, Io is one of the most colorful worlds yet seen in the Solar System, save the Earth of course. Publicly released images of Io from the Voyager and Galileo missions show a variety of colors on Io from reds surrounding Pele and Tvashtar, to yellow cyclo-sulfur and gray-white sulfur dioxide frost.  Greens and red-browns crop up across Io's mid-latitudes and polar regions, respectively, either from sulfur impurities or radiation damage.  However, the colors seen on most images of Io available on the internet use exaggerated colors, either from the use of filters that pick up light at wavelengths that are invisible to the human eye or by stretching the image to emphasize color differences from region-to-region.  Both are quite useful for science as they reveal regional compositional differences that might not be apparent to the naked eye.

On this blog and on my Io image website, I have processed Galileo images with limited amounts of color exaggeration added, creating true color images of Io.  I have done this by ensuring that the three images that make up each color composite use filters that allow photons in the visible spectrum to reach the camera's CCD (red, green, and violet) and by stretching each image in the color composite the same way.  For the latter, this means that each of the three images (per frame if it is a color mosaic) was calibrated so that the pixel values were equal to the intensity of detected photons divided by the incoming flux from the Sun (I/F) at each effective wavelength.  When I converted the data to a tiff format image (for editing in Photoshop), I linearly stretched all three color filters images so that the a pixel value of 0 was equal to the I/F of the black sky and 255 was equal to the maximum I/F seen in the RED filter (the brightest of the three color filters, at least for Io).  The image of Io against the clouds of Jupiter at right was processed in this manner.  As long as the images were properly photometrically calibrated, the resulting color images should be as close to true color as I can get without further manipulation of the images.

Now you may be asking yourself, "What do you mean 'without further manipulation of the images'?  Didn't you just say that you were 'creating true color images of Io'?"

As Björn Jónsson points out on his webpage, Io's color, Galileo and its predecessors, the Voyager space probes, did not carry the necessary filters that would correspond to the Red-Green-Blue color space most commonly used either as channels in Photoshop, as the color space of modern LCD monitors, or the three types of cones in the human eye.  Voyager's color filter set included ultraviolet (effective wavelength of 332 nanometers), violet (402 nm), blue (475 nm), green (564 nm), and orange (589 nm) filters. Galileo's color filter set included violet (404 nm), green (557 nm), and red (663 nm) filters as well as four narrow-band filters that were sensitive to light at near-infrared wavelengths (734, 756, 887, and 986 nm). 

Now for most bodies that are relatively bland in color at visible wavelengths, like most of Saturn's satellites, the differences between an object's appearance in blue and violet filters would be pretty minor, and so it would make little difference if a violet filter image was used in place of a blue filter one for the blue channel.  However, Io's albedo changes dramatically from a Galileo violet filter mean of 0.2771 to a green filter mean of 0.7443.  Thus, the filter used for the blue channel is important as Io's average brightness is strongly dependent on the effective wavelength of the filter.  Green and red filters for Galileo, Voyager, and Cassini are centered on either side of another ramp in Io's spectrum, and so they are less dependent on effective wavelength.  Voyager's lack of a red filter prevented it from detecting the red color of the Pele plume deposits (instead they appear dark or with a dark, red-brown hue in Voyager color composites).  With Galileo color composites, having to use a violet filter instead of a blue one for the blue RGB channel gives Io a strong, yellow hue, when it would likely be more muted.

You can see this in the two graphs below.  These compare Io's geometric albedo (charted in black in these two graphs) to the spectral responses of color filters used by the narrow-angle camera on Voyager 1 and SSI on Galileo.  Each colored curve represents the sensitivity of that filter to different wavelengths of light.  Both factor in the additional complication of the camera sensor's (CCD for Galileo SSI, vidicon for Voyager ISS-NA) sensitivities.  These data were obtained from the calibration reports for the Galileo and Voyager cameras.  In the case of the Voyager NAC, both the violet and blue filters are located in the steep spectral slope in Io's geometric albedo.  This slope is caused by the absorption of violet and ultraviolet sunlight by sulfur deposits on Io's surface.

In Voyager images, this slope means that there is a steep progression in the average brightness of Io from ultraviolet filter images to green filter ones.  For Galileo, the violet filter is located near the bottom of this ramp while the green one is located at the base of another slope that results from reddish material in Io's polar regions and near active volcanic centers like Pele.

So how do we go about generating true color images of Io from Galileo images?  First, I should point out that Galileo images are a better choice for synthesizing true color images since while the SSI camera may not have had an optimal filter set, at least it covered the full range of the visible spectrum, unlike the Voyager camera's vidicon sensor prevented it from detecting photons beyond 650 nm, cutting off a sizable portion of the red part of the spectrum.  As I said earlier, Björn Jónsson worked on this problem earlier, and created a method of synthesizing a blue filter by mixing the violet and green filter images.  He focused on recreating the overall appearance of Io as seen in blue filter Voyager images.  When combining this synthesized blue filter images with the normal red and green filter images, he hoped to create a data set that approximated Io's appearance as it would appear to the human eye.  He found that the best results came when blue channel pixel values could approximated as:
Blue = 0.61*Green + 0.39*Violet.
While this method seems to produce appropriate results, I am a bit concerned about using the Voyager blue filter for the blue channel.  Voyager used a blue filter that I feel was a bit to green and was closer to being a cyan filter.  Remember just because it is called a "blue" filter doesn't make it so :-)  So, what I've done instead is try to synthesize blue (BL1) filter images from Cassini, which is part of the true-color set of filters on the ISS camera system (BL1-GRN-RED).  The BL1 filter has an effective wavelength of 455 nm, a bit shorter than Voyager's blue filter.  This would better approximate the blue end of the CIE color chart.  I used following equation to mix a percentage of the green and violet filter pixel values to create a synthetic BL1 filter image:
Blue = 0.55*Green + 0.45*Violet.
These factors were calculated by finding Io's average geometric albedo at 455 nm (effective wavelength of the Cassini ISS BL1 filter), 404 nm (wavelength for the Galileo violet filter), and 557 nm (wavelength for the Galileo green filter) using ground-based spectral data published by Spencer et al. in 1995 (their data was also used for the Io spectrum in the graphs above). Then, I determined the weighted average between Io's albedo at 404 nm and 557 nm that would equal its albedo at 455 nm.  The image at right shows the same global color image from March 29, 1998: the version on the left is the original, unstretched version, and the one on the right has had this correction factor applied to its blue channel.  The version on the left should approximate a true-color image.  Instead of a vivid yellow world, Io appears more subdued, and many white-gray regions on Io appear more pinkish than they did before.

I know I have go on long enough with this article, but I want to point out a few caveats, just as Björn did.  Keep in mind that Io's surface materials have different spectra at visible wavelengths.  While most have steep spectral slopes between 350 and 500 nm resulting from sulfur before shallowing through the rest of the spectrum detectable by Galileo's camera, for red materials this steep slope continues on to around 750 nm before shallowing.  So the appearance of Io's reddish material would depend on the effective wavelength of the filter used for the red channel.  Both the Cassini and Galileo red filters are on the long side of the effective wavelength used for the red channel on most computer LCD's and the red cone in the human retina.  This makes reddish materials appear more vivid than they would in real-life, though not quite as muted as seen in Voyager color composites since the human eye is sensitive to longer wavelengths than the Voyager Orange filter even if its effective wavelength is closer to that of your red cones than the red filter on Cassini or Galileo.

Creating color composite images from spacecraft data is almost as much an art as science, and how you create them can depend on the image processor's preferences and the purpose of the processing.  I tend to prefer not to enhance the data anymore than necessary, and try to stay true to the original data, even if it isn't exactly true color.  That said, it has been an interesting journey into trying to create a "true" color Io image.  I may have to post a few more examples using the above formula.  I also realized that creating "true" color images may be affected by the conversions of the original DN values of the Galileo raw data to I/F (intensity over flux), so stay tuned on this.

References: 
Spencer, J.; et al. (1995). "Charge-coupled device spectra of the Galilean satellites: Molecular oxygen on Ganymede". Journal of Geophysical Research 100 (E9): 19,049–19,056.
Spencer, J.; et al. (1996). "Io on the Eve of the Galileo Mission". Annu. Rev. Earth Planet. Sci. 24: 125–190.
Geissler, P.; et al. (1999). "Global Color Variations on Io". Icarus 140: 265–282.

Tuesday, August 17, 2010

Io Volcano of the Week: Hi'iaka

This month for my Io Volcano of the Week series, we are looking at volcanoes that were observed at moderate resolution (160-280 meters or 525-920 feet per pixel) during Galileo's I25 flyby of Io on November 26, 1999.  In the last couple of weeks we have looked at Zal and Emakong, two large paterae - volcanic depressions - on Io's leading hemisphere.  This week we turn our focus a few hundred kilometers to the east of Emakong at the strangely shaped lava flow field, Hi'iaka Patera.  It maybe pretty quiet as far as Ionian volcanoes go, but it may have had a wild past with a violent formation from the breakup of two massive mountains and lava flows that formed in the 17 years between Voyager and Galileo.

Let's get some of the basics out of the way first.  Hi'iaka Patera is located near Io's equator on the moon's leading hemisphere (3.64° South, 79.47° West) and is 128 kilometers (80 miles) wide.  The oddly shaped volcano is bounded by a set of low faults that confine a lava flow field on the eastern side of the volcanic depression.  The western edge of Hi'iaka is bounded by a 3.5-kilometer (2.2-mile) tall massif named North Hi'iaka Montes.  The southern margin of the volcano is less than 10 kilometers (6.2 miles) from the northern tip of another mountain, South Hi'iaka Montes.

Images of Hi'iaka taken during that Thanksgiving 1999 flyby were particularly useful for determining how the volcano may have formed.  Observations of the spatial relationships between these two mountains and the volcano, the comparable heights for the two mountains (save the tall peak on the northeast tip of North Hi'iaka Montes) led to the suggestion that the two mountains were once joined.  Subsequent extension and strike-slip tectonism then rifted these two mountains.  In this scenario, Hi'iaka Patera may be a pull-apart basin, which forms when there is a bend or gap in a strike-slip fault system, creating extension at the bend.  The image at left shows a schematic of these basins are formed.  Depending on the speed of the rifting, lava can exploit the faults along the margin of this basin to reach the surface and cover portions of the depression that is formed between the two transform faults [this scenario was further explained back in December 2009 and February 2009 when I  discussed work performed by Melissa Bunte and her co-authors].  Lava using extensional faults on Earth certainly isn't unheard of.  The East African Rift Valley has a number of prominent active or dormant volcanoes (*cough* Kilimanjaro), and fissure eruption are not unheard of in the last few million years.  The active lava lake, Erta'ale, is located in the Afar triangle and the triple junction between the Red Sea, the Gulf of Aden, and the East African Rift Valley. The motions of Ionian micro-plates like that suggested for Hi'iaka Patera may have resulted in the formation of several volcanoes including Zal, Monan, and Shamshu, though additional information on Io's sub-surface will be needed to pin down this theory, since later deposition of volcanic ash and sulfur has obscured most surface expressions of tectonic faults on Io's surface.

In term of recent activity, Hi'iaka is a relatively quiescent.  While there are dark lava flows with different albedos (and presumably ages) covering much of the eastern half of the depression, no high-temperature eruptions have been observed at the site.  Galileo's Near-Infrared Spectrometer observed thermal emission from the volcano on six occasions during the Galileo Nominal Mission, but it was never seen by camera system during an eclipse, even though the nearby volcano, Tawhaki Patera, was.  This suggested that low levels of effusive activity were present at Hi'iaka during the Galileo mission, which is consistent with the morphology of the dark lavas seen in the high-resolution Galileo images.  Bunte et al. 2010 suggested that Hi'iaka Patera might be a lava lake, or in the process of forming one.  At present, however, the morphology of the dark lava at Hi'iaka, with its multi-lobed structure and suggestions of a series of overlapping flows, is more consistent with an inflated flow field that is built up by a series of thin lava breakouts.  Similar eruptions, though more vigorous, are seen across Io at volcanoes like Zamama, Prometheus, Marduk, and Amirani.

That's not to say that more vigorous eruptions are not possible.  A faint, reddish plume deposit was seen surrounding Hi'iaka when Galileo first started imaging Io in June 1996 that slowly faded as the mission progressed.  Even more curiously, Hi'iaka is barely visible in Voyager images of the region taken in 1979.  This suggestions that the lava flows Galileo and later New Horizons saw at Hi'iaka formed between 1979 and 1996, in same time frame as Zamama and the new flow fields at Prometheus and Culann.  Using the Pillan eruption as a possible template, perhaps it is possible that these flow fields built up quickly, on the scale of only a few months.  As the eruptions died down, activity at these volcanoes may have transitioned to from a violent, fire-fountaining, outburst eruption to a more quiescent insulated lava flow.  However, given the number of years between Voyager and Galileo, there is no reason to require an initial outburst at these flow fields, and they may have built up gradually over the 16 year time span.  However, I will point out that only minor expansions of the extent of these flow fields were ever seen during 4 years of the Galileo mission at Io.  Several outbursts were known to have occurred in Hi'iaka's region (or at least its hemisphere) during this interval that may have resulted in the initial creation of the Hi'iaka flow field, including a bright outburst seen in 1986 that provided evidence for silicate volcanism on Io.

That's it for this week's star volcano, Hi'iaka Patera.  Come back next week when we will profile the colorful Culann.

References: 
Bunte, M.; et al. (2010). "Geologic mapping of the Hi’iaka and Shamshu regions of Io". Icarus 207: 868–886.
Turtle, E. P.; et al. (2001). "Mountains on Io: High-resolution Galileo observations, initial interpretations, and formation models". Journal of Geophysical Research 106 (E12): 33175–33199.
Johnson, T. V.; et al. (1988). "Io: Evidence for Silicate Volcanism in 1986". Science 242 (4883): 1280–1283.

Wednesday, August 11, 2010

DPS 2010 Meeting Abstracts Posted Online

The abstracts for the 42nd Meeting of the Division for Planetary Sciences of the American Astronomical Society (DPS) were posted online earlier today.  The annual DPS meeting focuses on a variety of planetary science topics.  This year's meeting is scheduled for October 4-8 and will be held at the Pasadena Convention Center in Pasadena, California.

Two Galilean satellite oral sessions planned during the mornings of Wednesday, October 6 and Friday, October 8.  A poster session is also planned for the afternoon of October 6. In addition to these Galilean sessions, there is a town hall meeting covering the Europa/Jupiter System Mission during lunch on Tuesday, October 5.

Five talks and three posters are planned during Galilean Satellite sessions scheduled for October 6.  I have listed them below.

Talks
Posters
Link: DPS 2010 [dps.aas.org]

      Tuesday, August 10, 2010

      Blogger Static Pages at The Gish Bar Times

      As some of you may have noticed, over the last couple of weeks, I have been taking advantage of Blogger's new Pages system, which allow me to add static pages to the blog and link them using tabs below the heading banner.  If you haven't noticed them, or read my blog using an RSS Reader and therefore haven't seen them, I encourage you to check them out or use them for reference if need be.  I have converted the Io Basics posts I wrote a few months into a static page for easier reference, and will use that to present a more extended introduction to Io and my blog.  The Io Information page is basically a copy of the three main Wikipedia articles on Io (Io, Exploration of Io, and Volcanism on Io) and provides a more extended introduction to Ionian science than what is provided in the About Gish Bar Times page.  I have also added an index of the Io Volcano of the Week articles and an informative table on spacecraft encounters with Io, both past and future.

      Perhaps the most significant static page I have added is a zoomable global map of Io.  The map is based on the USGS global basemap and includes labels for named surface features.  The Zoomify map, based on Adobe Flash, allows you to zoom in on the global map as well as pan around using the buttons at the bottom of the player, the navigation inset at top left, or clicking and dragging across the image.  You can even expand the image to display full-screen on your computer monitor.  In the future I hope to add more functionality to this page, including separate layers for the labels and another indicating the location of plumes and hotspots.  Not sure I can do that with Zoomify, so I am open to other suggestions for perhaps using other platforms.

      Link: Zoomable Global Map of Io [www.gishbartimes.org]

      Monday, August 9, 2010

      Io Volcano of the Week: Emakong

      This month for my Io Volcano of the Week series, we are looking at volcanoes that were observed at moderate resolution (160-280 meters or 525-920 feet per pixel) during Galileo's I25 flyby of Io on November 26, 1999.  Last week, we examined Zal Patera, a large volcano on Io's northern hemisphere that has been the site of large lava flows and a small volcanic plume.  This week we take a look at Emakong Patera, a large lava lake smack dab in the middle of Bosphorus Regio.  While a largely inactive lava lake during the Galileo mission, high-resolution observation of this volcano by the camera and near-infrared spectrometer on Galileo have relaunched the debate over the predominance of sulfur and silicate volcanism on Io.

      Emakong Patera, like Zal Patera described last week, is a larger than average, roughly heart-shaped patera, or volcanic depression, being 79 kilometers (49 miles) long north to south and 72 kilometers (45 miles) wide west to west.  The name of the volcano is derived from the mythology of the Sulka people of the southeast coast of the island of New Britain in Papua New Guinea.  In the myth, Emakong dives into a stream to retrieve an ornament he dropped.  Upon reaching the bottom, he found that he was in the yard in front of a house.  The people from this house allowed him to stay for the night around the hearth fire, both alien concepts to Emakong.  The next morning, Emakong was given night and fire as gifts to bring back to his own people.  Unlike another volcano named for a mythical fire bringer, Prometheus, Emakong had never been seen as a very active volcano, despite its dark surface and numerous surrounding lava flows.

      The surrounding lava flows however, are not dark but are bright instead.  Bright white to yellow flows radiate for up to 370 kilometers (230 miles) from the edge of Emakong across much of Bosphorus Regio.  Based on medium-resolution imagery acquired in November 1999, researchers discovered that some of these flows are fed by narrow channels that formed when lava overflowed the walls of the Emakong basin.  Other bright flows, particularly along the western margin of Emakong, appear to be broader over-flows from the patera.  Galileo scientists suggests that rather than being composed of silicate basalt like most of the lavas seen on Io, instead Emakong's lava flows are composed of sulfur.  When quenched at different temperatures, cooled sulfur flows can have different colors.  The higher the quenching temperatures, the darker and red the cooled flows appear.  So it would follow that the cooled sulfur lava in the channels that feed the bright flows and on the floor of Emakong Patera is darker than the bright flows themselves, as they were quenched at higher temperatures.

      Alternatively, the flow may have originated as a silicate flow that was over time covered more and more by sulfur.  Such as process is seen at Chaac Patera, where brighter sulfur ponds in the valleys within the silicate lava that covers the patera.  Over time, this slowly brightens the lava flow.  Like Chaac, Emakong also has a greenish color, thought to form from the interaction between cooling, iron-rich silicate lavas and sulfur.  Personally, I prefer this theory over one that suggests that this is a sulfur flow.  During the Galileo and New Horizons, several examples were observed where bright yellow flows were covered over by basaltic lava during more recent high-temperature eruptions.  This provides a potential connection between current activity on Io and earlier activity, though there are examples on Earth where the same volcanic vent has been known to release both sulfur and silicate lava.  While Emakong has been generally inactive in the current epoch, it is always possible the volcano may later re-activate these flows, forming broad silicate lava flows to cover the older sulfur-coated flows.

      Emakong and the dark channel that flows to the east from its margin were imaged at high spatial resolution by both the SSI and NIMS instruments on Galileo in October 2001.  The mosaic at right shows the southwest margin of Emakong Patera with its dark band of hot lava along its outer margin.  The dark channel that is the focus of this observation starts out as a crusted over, multi-braided channel near the edge of Emakong before turning into an open channel after flowing a few kilometers to the east.  The morphology of the channel in this region is similar in appearance to lava lake overflow channels that have formed at Kilauea when the overflow occurs over an entire sector of the lake with hot, low-viscosity lava that had a variable flow-rate.  The flanks of the channel are formed by relatively dark material, which is itself surrounded by bright material.  Further downstream, the channel becomes broader and progressively more crusted over, suggestive of the transition from an open channel lava flow to a lava tube.

      The mix of bright and dark material in the plains southwest of Emakong Patera is difficult to assess.  The lack of clear topographic shading makes it difficult to even determine whether bright material lies on top of dark, or vice versa, which is needed to determine stratigraphy of these lavas.  The shading nearer the lava channel does suggest that lava over flowing the channel is initially dark before becoming bright, which could occur if hot sulfur is quenched near the channel, while cooler sulfur is quenched more distally.  Strangely, the interplay between bright and dark does appear similar to another Galileo observation, a 5.5-meter (18-foot) per pixel mosaic east of Isum Patera taken in February 2000.  In both cases, the complexity of the scene makes it difficult to assess the relationship between bright and dark material.  In both cases, a bright lava flow is covered at high-resolution. Discussion of that observation may have to wait for another day.

      What of Emakong Patera itself, what type of volcanic activity occurs there?  The patera was not seen as a hotspot until the Galileo flybys in November 1999 and February 2000.  These low-resolution observations indicated the presence of either cooled silicate or warm sulfur flows on the floor of the volcano.  A high-resolution (2 kilometers or 1.25 miles per pixel) NIMS observation was obtained over Emakong Patera during a Galileo flyby in October 2001.  This observation confirmed the presence of warm material on the floor of the patera, at least compared to the surrounding terrain.  While much of the patera floor had a consistent temperature, the margins were much warmer, reaching a peak near 270 ± 90 K (26±194°F).  This observation is consistent with a quiescent lava lake, as the warmer temperatures along the margin correlate with a ring of dark material that lines the outer margins of the patera.  The temperatures detected by NIMS are still too cool for even molten sulfur (unless it is highly impure and forms a low-temperature eutectic), suggesting that regardless of whether Emakong is a site of sulfur or silicate volcanism, it was relatively inactive during the Galileo mission (and there is nothing to suggest that this has changed since the mission ended).  The temperatures within Emakong are also low enough for sulfur dioxide frost to be detected in the same pixel as a thermal hotspot, the only place on Io this has been detected.

      While the debate between the predominance of sulfur or silicate volcanism has been settled for much of Io in favor of silicate volcanism, Emakong is one of several locations where uncertainty remains.  Regardless of whether sulfur or silicate volcanism dominates at Emakong, it has been years since it was last active beyond thermal emission from warm lava leaking out through cracks in the crust of the Emakong lava lake, unless the sulfur is highly impure and forms a low-temperature eutectic.  The large bright lava flows surrounding Emakong tell the tale of past glory for the volcano, which may one day erupt again to flood hundreds of square kilometers in hot silicate or sulfur lava.

      References:
      Williams, D.; et al. (2001). "Evaluation of sulfur flow emplacement on Io from Galileo data and numerical modeling". Journal of Geophysical Research 106 (E12): 33,161–33,174.
      Keszthelyi, L.; et al. (2001). "Imaging of volcanic activity on Jupiter's moon Io by Galileo during the Galileo Europa Mission and the Galileo Millennium Mission". Journal of Geophysical Research 106 (E12): 33,025–33,052.
      Turtle, E.; et al. (2004). "The final Galileo SSI observations of Io: orbits G28-I33". Icarus 169: 3–28.
      Lopes, R.; et al. (2004). "Lava lakes on Io: observations of Io’s volcanic activity from Galileo NIMS during the 2001 fly-bys". Icarus 169: 140–174.